Examples Gallery
This gallery contains examples demonstrating the features and capabilities of dartwork-mpl. Browse the categories below for ready-to-use patterns and techniques.
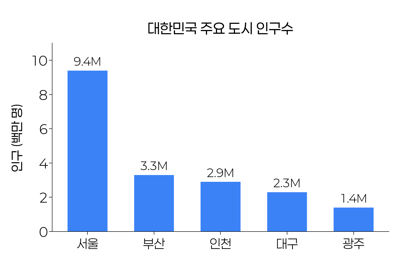
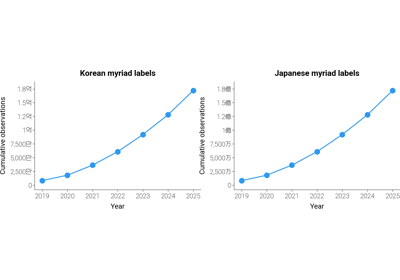
Styling and Themes
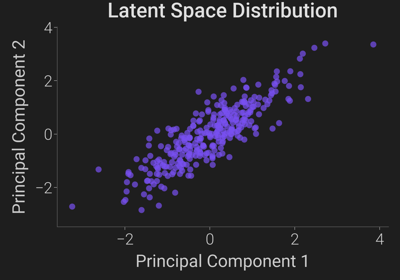
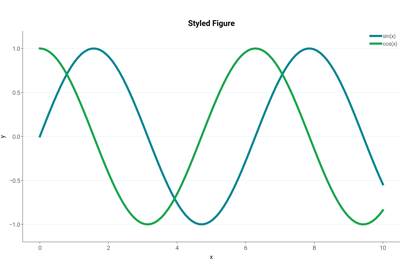
Explore dartwork-mpl’s dynamic style presets, built-in bilingual Korean font support using Pretendard, and specialized dark mode settings tailored for modern dashboards.

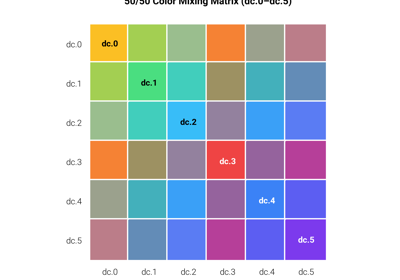
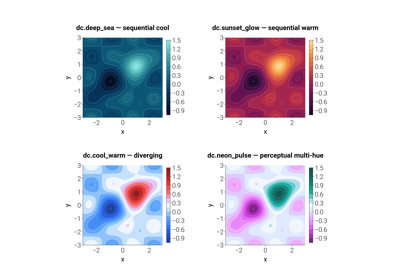
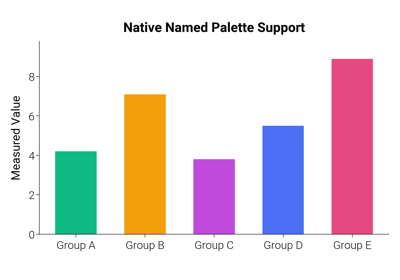
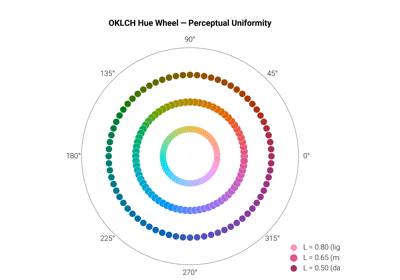
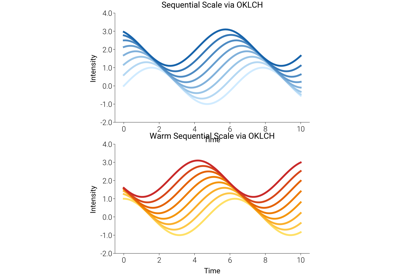
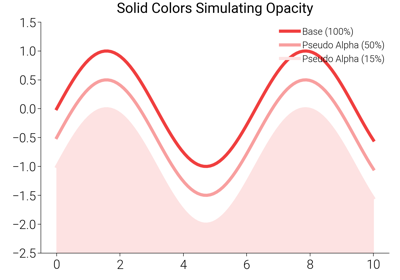
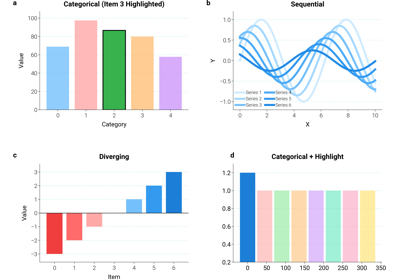
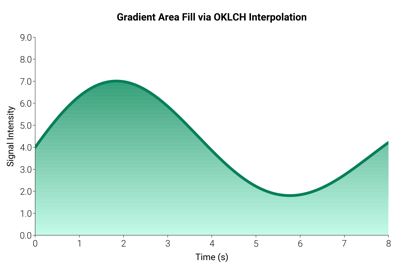
Color System
Showcases the power of the dartwork-mpl color management system, including named palettes (Open Color, Tailwind), perceptually uniform interpolation in OKLCH space, and intelligent opacity handling.
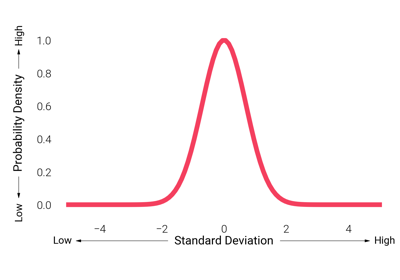
Formatting
Format axes, ticks, and value annotations with dartwork-mpl helpers.
These examples cover decimal-aware tick formatters, directional axis
arrows, and helpers that turn raw bar/line data into clean, labelled
chart deliverables.
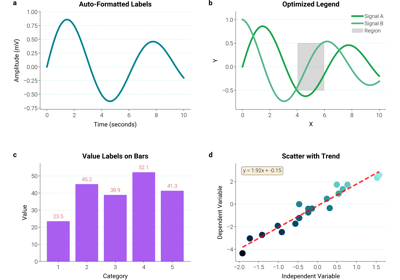
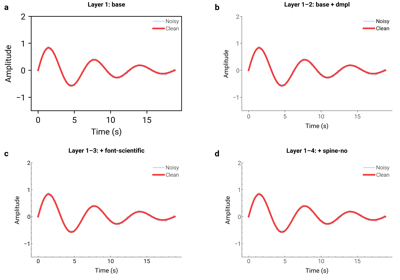
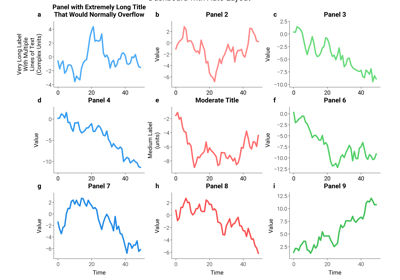
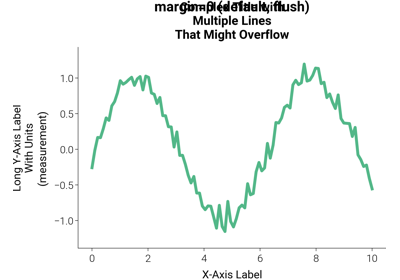
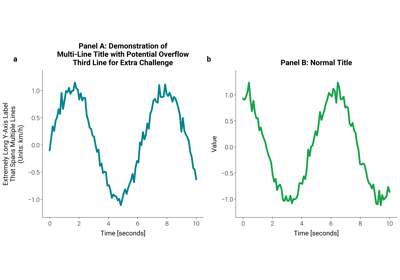
Layout and Annotations
Discover dartwork-mpl’s dynamic layout solver (which prevents label overlapping better than tight_layout) and advanced annotation helpers for publication-ready figures.
Helpers API
The dartwork_mpl.helpers namespace bundles short, opinionated
utilities for everyday plotting tasks: figure creation with style,
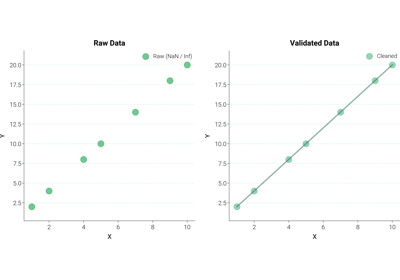
automatic colour selection, data validation, figure quality checks,
and complete end-to-end workflows. Each example demonstrates one
helper module in isolation.
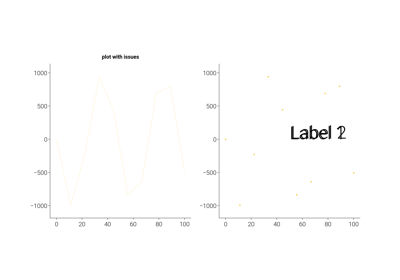
helpers.quality — Figure Quality Checks and Chart-Type Suggestion
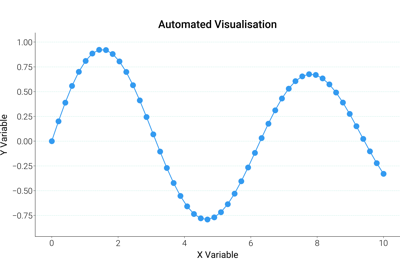
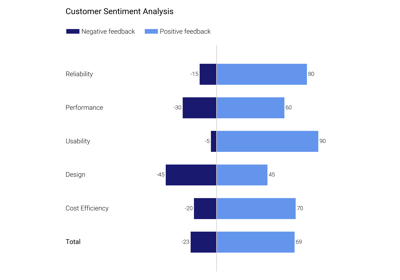
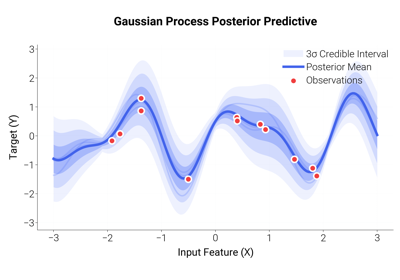
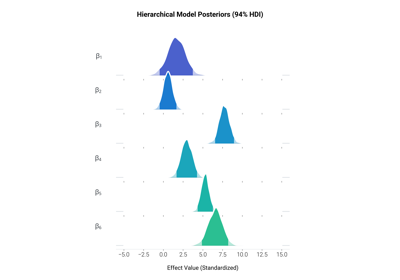
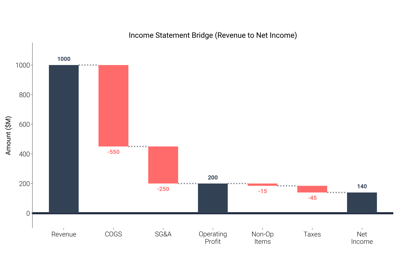
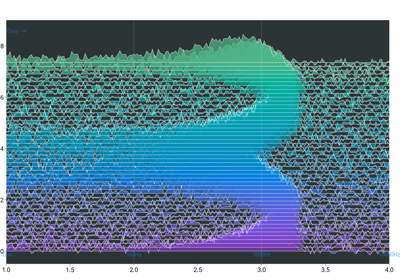
Chart Recipes
Ready-to-adapt chart templates that combine dartwork-mpl’s styling,
colour, and layout primitives into production-grade chart types:
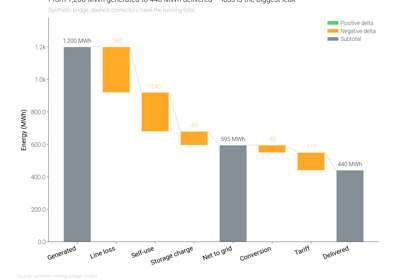
diverging bars, waterfall bridges, gradient-filled areas, MCMC
posterior ridgelines, Gaussian-process regression bands, and icon
infographics.
Real-World Dashboards
This gallery showcases complete, production-ready dashboard examples that combine multiple dartwork-mpl features — composite layouts, semantic colors, hierarchical typography, and auto-layout — on realistic sample data.
Each example focuses on one chart in one figure so that the techniques are easy to isolate, remix, and drop into a larger multi-panel report.
Example Domain
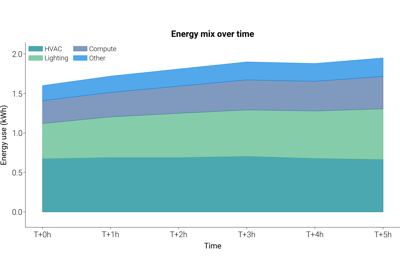
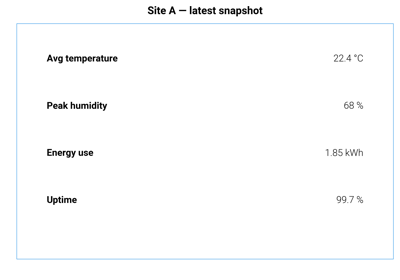
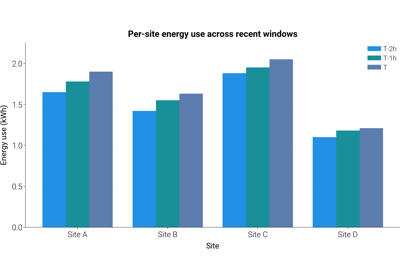
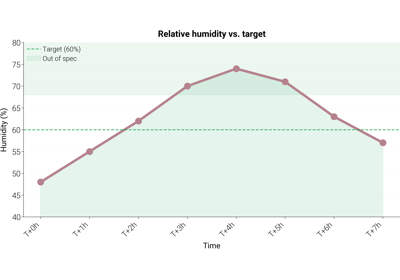
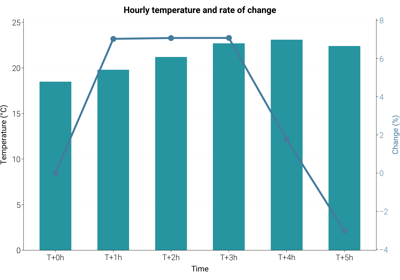
All examples in this gallery render a consistent synthetic dataset: a small fleet of environmental sensors reporting temperature, humidity, and power draw at several sites over time. The choice of domain is incidental — the visual patterns (dual-axis trends, stacked components, threshold overlays, grouped comparisons, summary cards) transfer directly to any time series or categorical data.
Techniques Demonstrated
Composite dashboards: plt.figure + GridSpec for multi-panel layouts
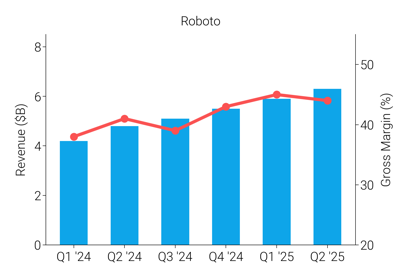
Dual-axis time series: bar + line on shared x-axis with a secondary y-axis
Stacked area charts: component mix over time
Threshold-annotated trends: reference lines and shaded bands
Grouped bar comparisons: side-by-side categories across periods
Text-only summary cards: axis(“off”) + ax.text for KPI tiles
Conventions
All dashboards follow dartwork-mpl conventions:
Preset styles:
dm.style.use("report")(or"report-kr"for Korean copy) is applied before any figure is created.Relative typography: titles and labels use
dm.fs(n)so that a preset change rescales the whole figure uniformly.Named colors: charts pull from the
oc.*andtw.*palettes instead of raw hex strings.Auto-layout:
dm.simple_layout(fig)is called beforeplt.showso that margins adapt to actual content rather than static values.Single chart per file: each example renders exactly one figure. To assemble a multi-panel dashboard, compose the individual snippets inside a single GridSpec.
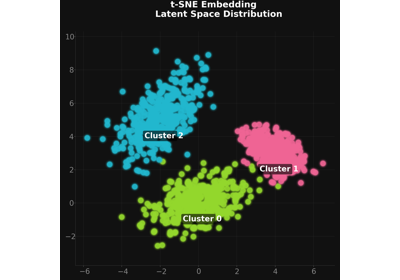
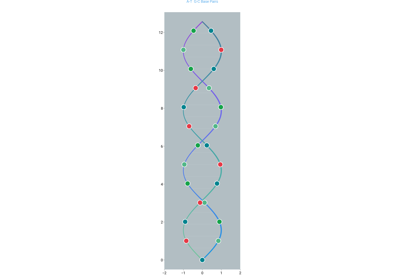
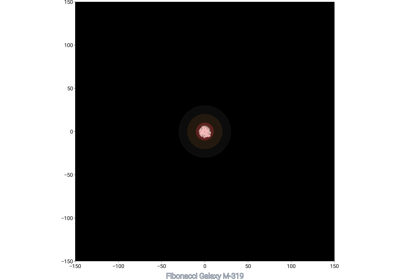
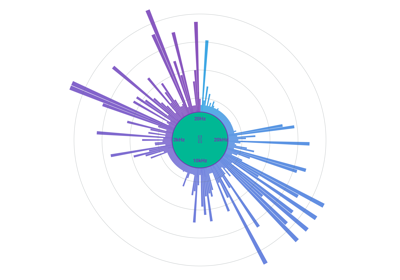
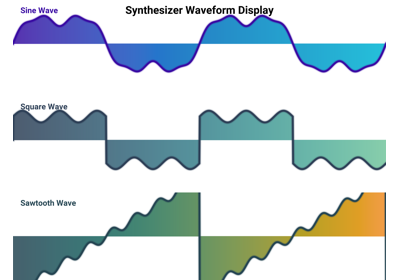
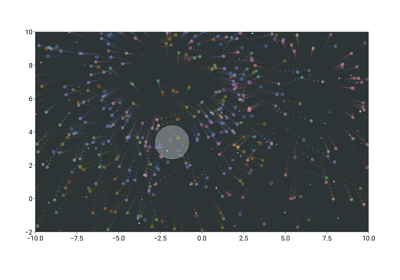
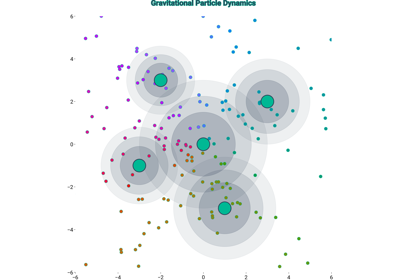
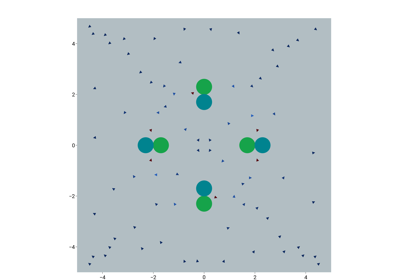
Creative Visualizations
Artistic and creative examples showcasing the expressive capabilities of dartwork-mpl.
AI Plot Templates
Eighteen ready-to-use plot templates curated for AI coding assistants. Each
template is a small, self-contained script written with the
figsize=dm.figsize(...) API and the curated dc.* palette. They are
bundled in the wheel under dartwork_mpl/asset/prompt/05-templates/ and
exposed through both the prompt utilities and the
MCP server.
How to access these templates
import dartwork_mpl as dm

# Read a template script as text
bar_src = dm.get_prompt("05-templates/bar")

# Or list everything available under prompts/
print(dm.list_prompts())
Or via MCP from Claude / Cursor / Continue:
dartwork-mpl://templates/{plot_type}
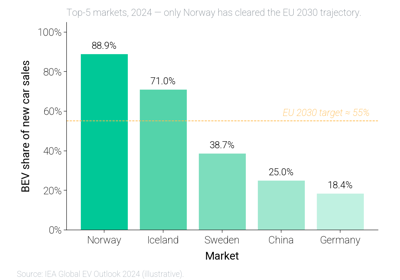
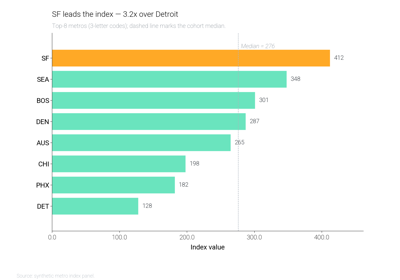
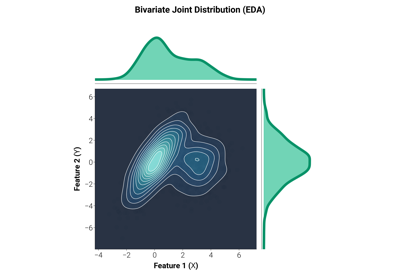
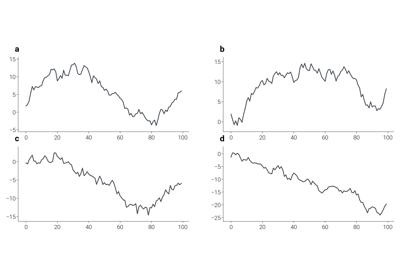
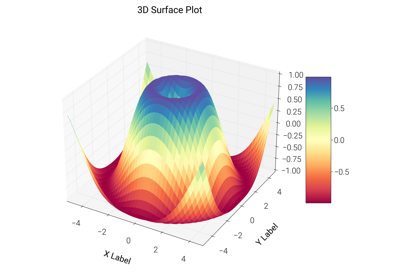
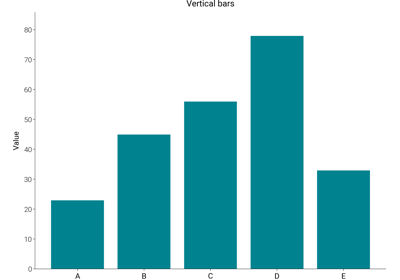
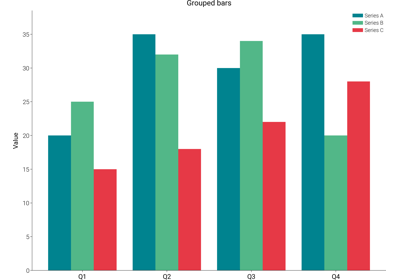
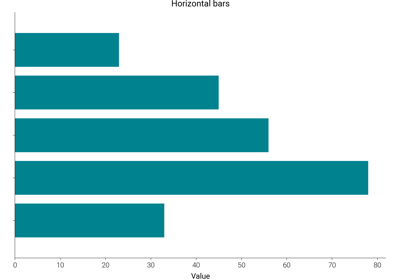
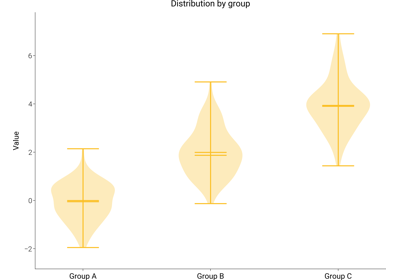
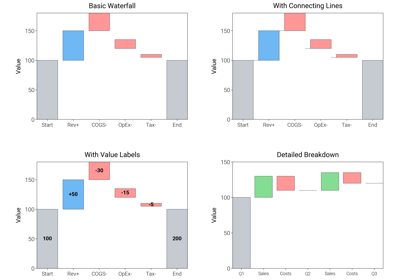
where {plot_type} is one of bar, bar_horizontal,
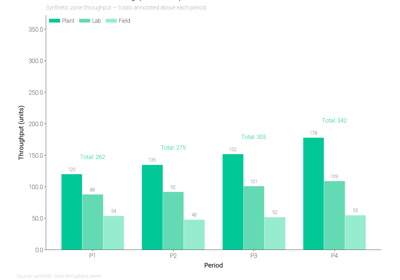
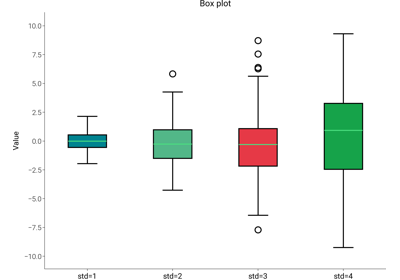
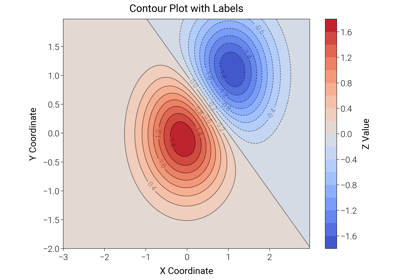
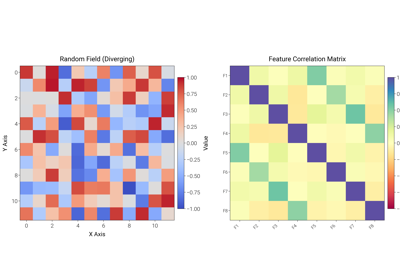
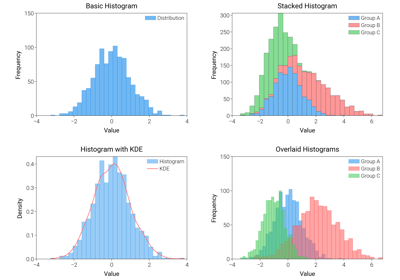
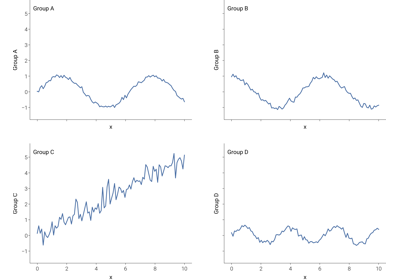
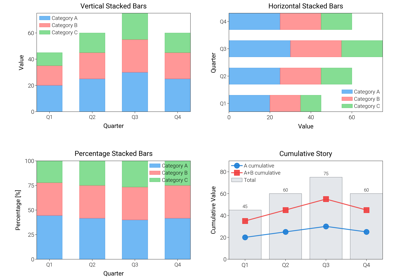
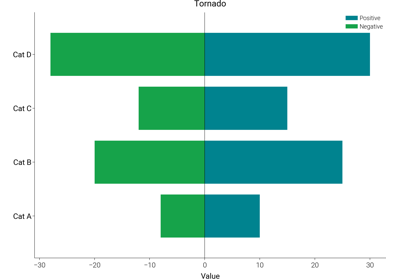
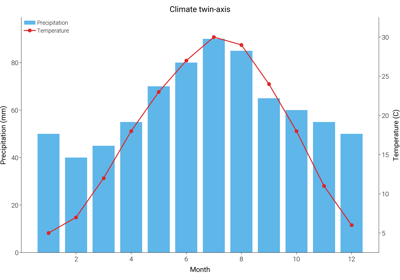
bar_grouped, boxplot, contour, heatmap, histogram,
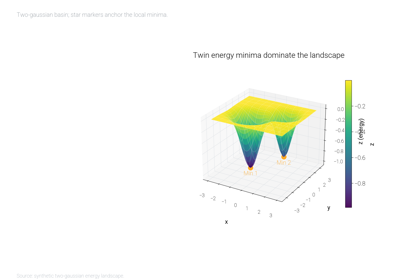
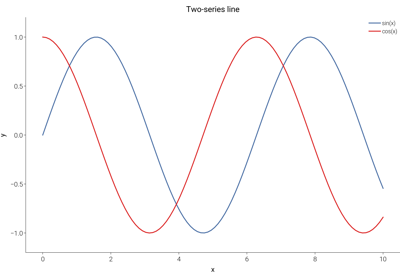
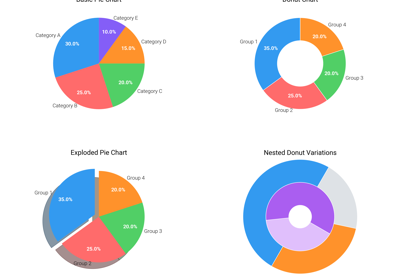
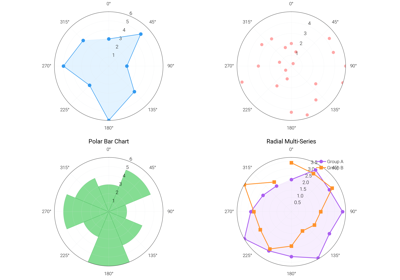
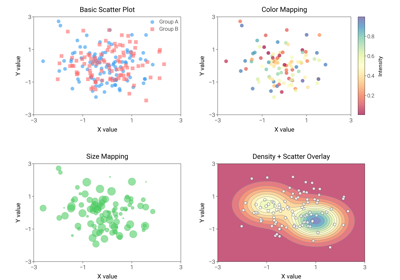
line, pie, plot_3d, polar, scatter, small_multiples,
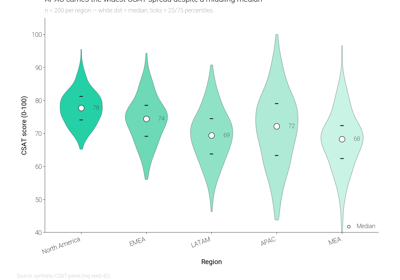
stacked_bar, tornado, twin_axis, violin, or waterfall.
The gallery entries below render each template so you can pick the right
shape at a glance, then copy the source from the page (or fetch it via
dm.get_prompt) into your project.
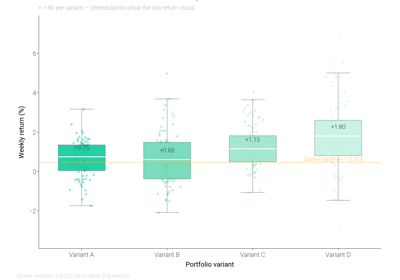
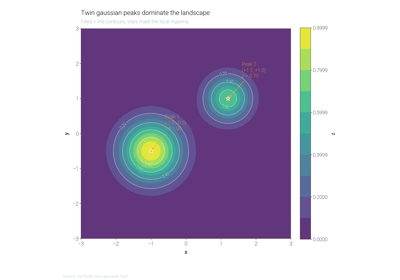
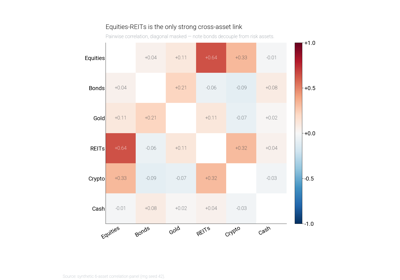
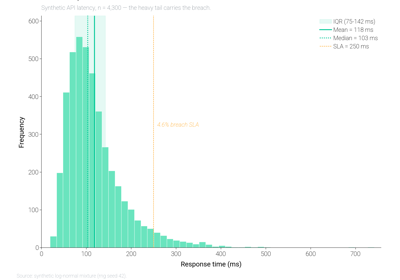
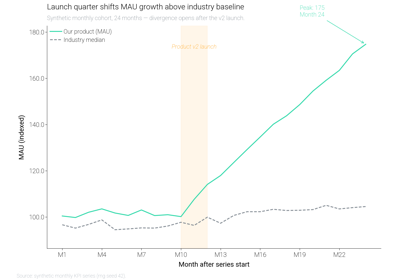
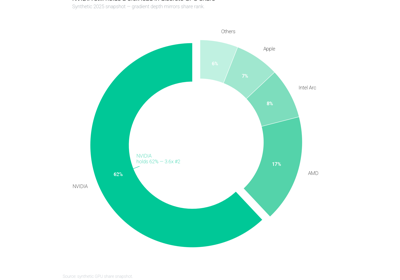
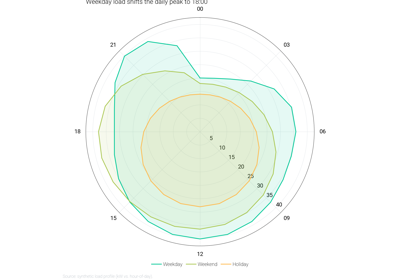
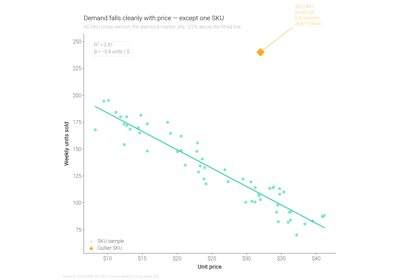
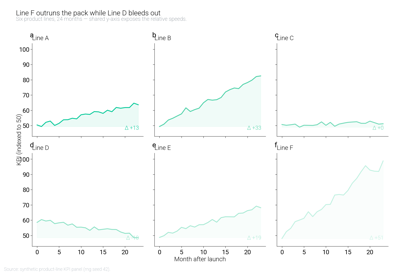
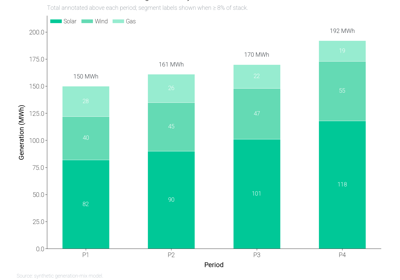
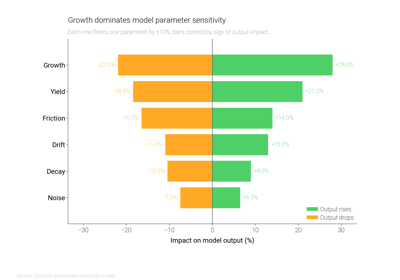
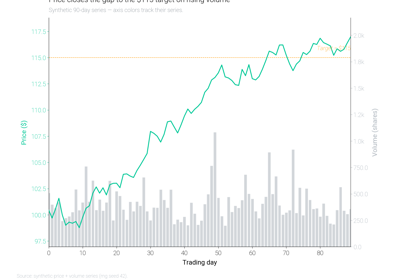
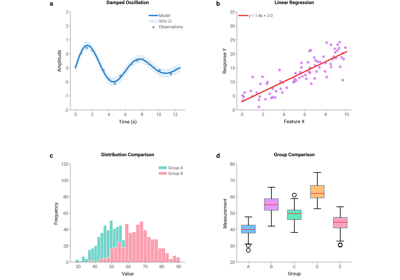
Advanced AI Plot Templates (Tier 2)
Tier-2 templates extend each basic plot type with:
Believable synthetic data (a story, not random noise)
Reference lines / event windows / threshold annotations
Per-element value labels (bars, points, segments)
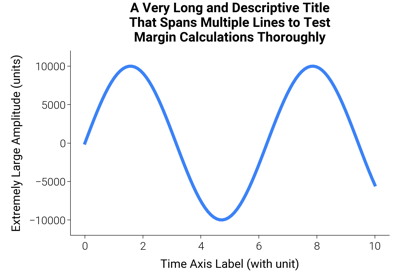
Narrative title + takeaway subtitle
Source footnote
Self-validation via
dm.validate_with_fixes+dm.check_figure_quality
Use these as the gold standard when you want the AI-generated plot to read like a finished report figure. See the basic gallery one level up for the minimal “just get a chart out” version.