Note
Go to the end to download the full example code.
Boxplot (Advanced)
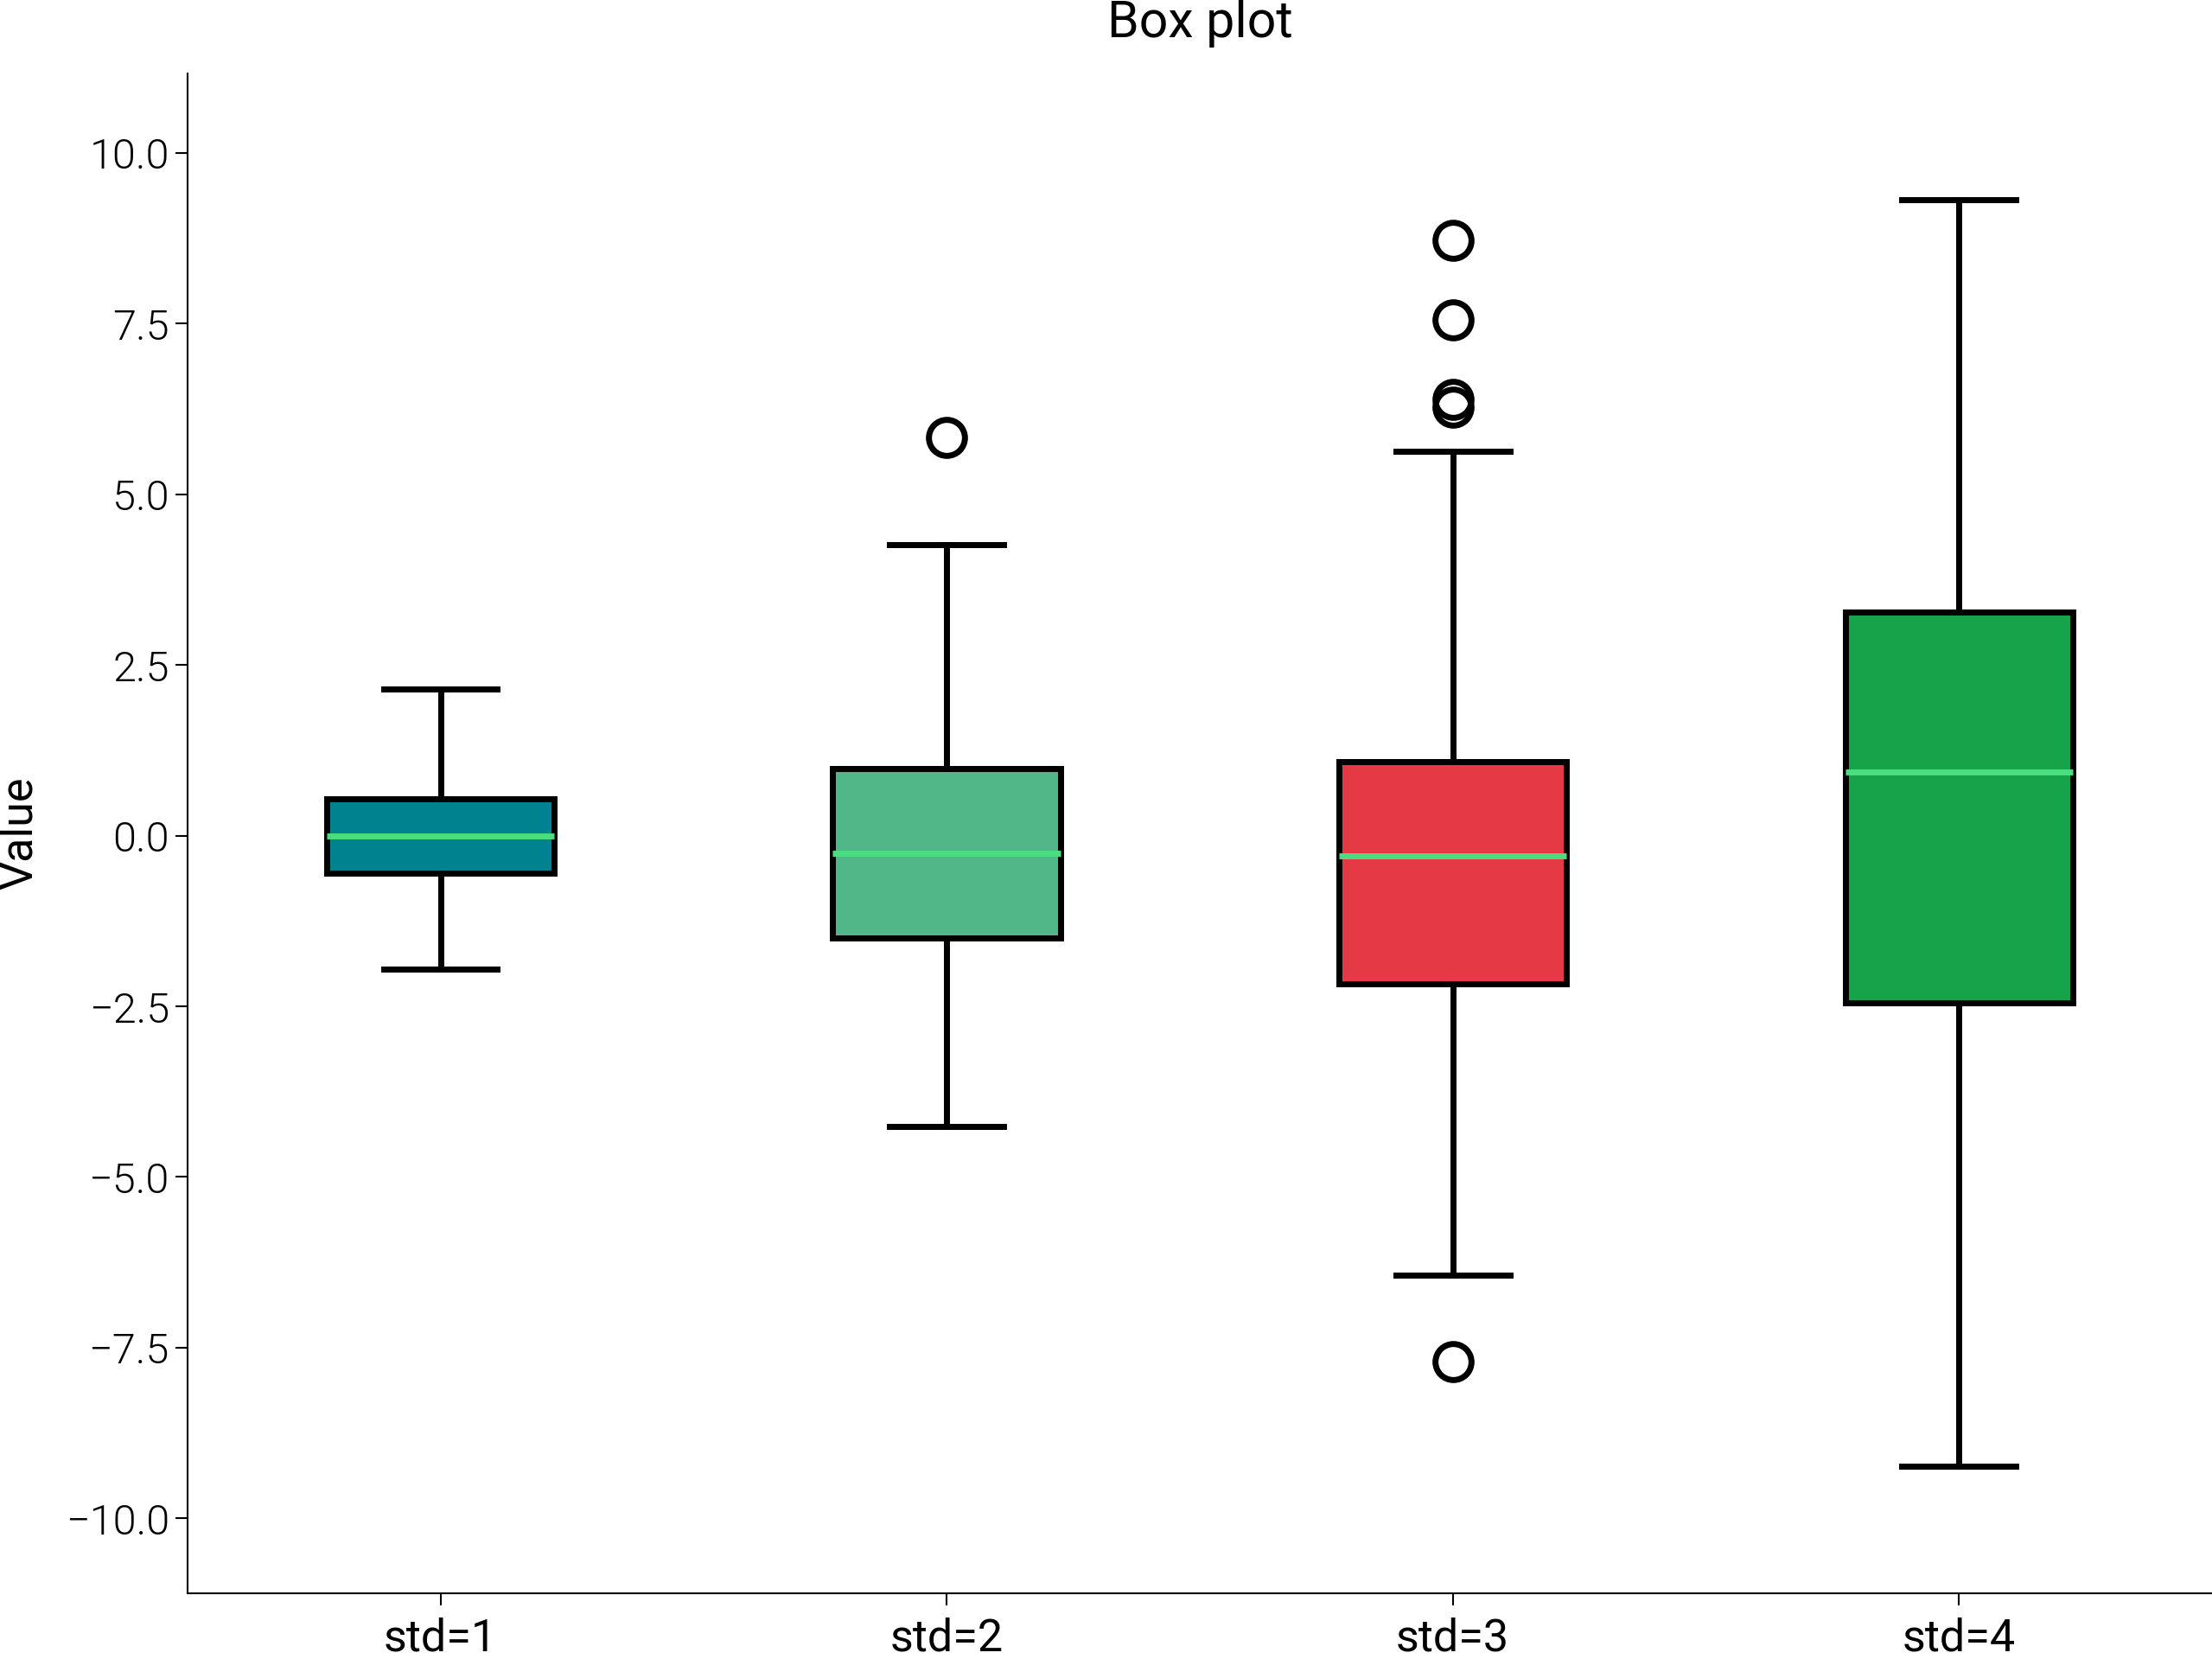
Boxplot — advanced template (gradient bodies + jittered raw points + baseline).
Source: dartwork_mpl/asset/prompt/05-templates/advanced/boxplot.py ·
MCP dartwork-mpl://template/advanced/boxplot.
[VISUAL] ⚠️  TEXT_CONTRAST: Text contrast 1.92:1 is below the 4.5:1 AA threshold for normal text (sample: 'Market baseline = 0.45%')
[VISUAL] 💡 TEXT_CONTRAST: Text contrast 3.32:1 is below the 4.5:1 AA threshold for normal text (sample: 'n = 80 per variant — jittered points ...')
[VISUAL] ⚠️  TEXT_CONTRAST: Text contrast 2.07:1 is below the 4.5:1 AA threshold for normal text (sample: 'Source: synthetic A/B/C/D return pane...')
[VISUAL] 💡 GRAYSCALE_SAFETY: The project modeled-relative-Y proximity heuristic before compositing found source-RGB pairs below its ΔY threshold; inspect ΔEOK separation: #ffbb50/#63d6b1, #ffbb50/#94e4c9

=== FIX SUGGESTIONS ===
[VISUAL] ⚠️  TEXT_CONTRAST: Text contrast 1.92:1 is below the 4.5:1 AA threshold for normal text (sample: 'Market baseline = 0.45%')
[VISUAL] 💡 TEXT_CONTRAST: Text contrast 3.32:1 is below the 4.5:1 AA threshold for normal text (sample: 'n = 80 per variant — jittered points ...')
[VISUAL] ⚠️  TEXT_CONTRAST: Text contrast 2.07:1 is below the 4.5:1 AA threshold for normal text (sample: 'Source: synthetic A/B/C/D return pane...')
[VISUAL] 💡 GRAYSCALE_SAFETY: The project modeled-relative-Y proximity heuristic before compositing found source-RGB pairs below its ΔY threshold; inspect ΔEOK separation: #ffbb50/#63d6b1, #ffbb50/#94e4c9
# ai-template-meta-start
# tier: advanced
# basic_counterpart: boxplot
# use_case: Group return distributions with raw points overlaid and a baseline reference
# difficulty: intermediate
# data_shape: groups: dict[str, list[float]]
# tags: distribution, boxplot, jitter, baseline, narrative
# narrative: A/B/C/D portfolio variant weekly returns; market baseline drawn as axhline
# advanced_apis: patch_artist boxplot with dm.cspace gradient, jittered scatter overlay (alpha 0.4), axhline baseline, median annotations
# ai-template-meta-end

import matplotlib.pyplot as plt
import numpy as np

import dartwork_mpl as dm

dm.style.use("scientific")

rng = np.random.default_rng(42)
groups = {
    "Variant A": rng.normal(0.6, 1.2, 80),
    "Variant B": rng.normal(0.9, 1.4, 80),
    "Variant C": rng.normal(1.3, 1.1, 80),
    "Variant D": rng.normal(1.7, 1.8, 80),
}
labels = list(groups.keys())
data = [groups[k] for k in labels]
medians = [float(np.median(g)) for g in data]
market_baseline = 0.45  # synthetic weekly market return

# Gradient: deepest for the rightmost (highest median) — sequential.
gradient = dm.cspace("dc.teal5", "dc.teal1", n=len(labels))
colors = [c.to_hex() for c in gradient]

fig, ax = plt.subplots(figsize=dm.figsize("14.5cm", "standard"))

bp = ax.boxplot(data, patch_artist=True, widths=0.55, showfliers=False)
for patch, color in zip(bp["boxes"], colors, strict=False):
    patch.set_facecolor(color)
    patch.set_edgecolor("oc.gray7")
    patch.set_linewidth(0.3)
    patch.set_alpha(0.85)
for line in bp["medians"]:
    line.set_color("white")
    line.set_linewidth(dm.lw(0))
for line in bp["whiskers"] + bp["caps"]:
    line.set_color("oc.gray7")
    line.set_linewidth(0.3)

# Jittered raw points underneath.
for i, (color, vals) in enumerate(zip(colors, data, strict=False)):
    x_jitter = rng.normal(i + 1, 0.06, size=len(vals))
    ax.scatter(
        x_jitter,
        vals,
        s=8,
        color=color,
        edgecolor="white",
        linewidth=0.2,
        alpha=0.4,
        zorder=1,
    )

# Market baseline.
ax.axhline(
    market_baseline, color="dc.amber4", linewidth=0.5, linestyle="--", zorder=2
)
ax.text(
    len(labels) + 0.3,
    market_baseline,
    f"Market baseline = {market_baseline:.2f}%",
    fontsize=dm.fs(-1),
    color="dc.amber5",
    ha="right",
    va="bottom",
    fontstyle="italic",
)

# Median callouts above each box.
for i, m in enumerate(medians):
    ax.text(
        i + 1,
        m + 0.3,
        f"{m:+.2f}",
        ha="center",
        va="bottom",
        fontsize=dm.fs(-1),
        fontweight=dm.fw(1),
        color="oc.gray8",
    )

ax.set_xticklabels(labels)
ax.set_ylabel("Weekly return (%)")
ax.set_xlabel("Portfolio variant")

ax.set_title(
    "Variant D's median lift comes with the widest spread",
    fontsize=dm.fs(1),
    fontweight=dm.fw(1),
    loc="left",
    pad=18,
)
ax.text(
    0.0,
    1.02,
    "n = 80 per variant — jittered points show the raw return cloud.",
    transform=ax.transAxes,
    ha="left",
    va="bottom",
    fontsize=dm.fs(-1),
    color="oc.gray6",
)

fig.text(
    0.01,
    0.005,
    "Source: synthetic A/B/C/D return panel (rng seed 42).",
    fontsize=dm.fs(-2),
    color="oc.gray5",
    ha="left",
    va="bottom",
)

dm.simple_layout(fig, margin=dm.inch(0.08))
dm.validate_with_fixes(fig)

issues = dm.check_figure_quality(fig)
if issues:
    print(f"[boxplot-advanced] quality issues: {issues}")

dm.save_formats(fig, "boxplot_advanced")
Total running time of the script: (0 minutes 0.618 seconds)