Color class
Most plots do not need the Color class: a named token, palette, or colormap is usually enough. When you do need to create, adjust, and export one color, the shortest path is:
Modeled relative CIE Y (relative_y) is calculated from nominal D65 sRGB; it
is not a measurement of a particular display, perceived brightness, or OKLab
L.
color = dm.oklch(0.7, 0.15, 150)
color.oklch.C *= 1.2
hex_value = color.to_hex()
L is the model’s lightness coordinate, C controls how colorful or muted
the color is, and h chooses the hue angle.
The Color class is the programmatic fourth entry point in the design system:
use it when a named token, discrete palette, or registered colormap is not the
right shape. It is the engine behind color construction, conversion,
manipulation, interpolation, and custom colormap registration.
dartwork-mpl uses OKLab and OKLCH — perceptual color spaces designed so numeric distances track visual differences more consistently than RGB. They are useful approximations, not a promise that every equal distance looks exactly equal to every observer. This page covers:
Creating Color objects from any format
Converting between color spaces
Modifying individual color channels
Interpolating smooth gradients (and why the color space matters)
Building custom colormaps for matplotlib
Why color spaces matter
Traditional RGB mixes colors the way a screen does — by blending light channels. That’s convenient for hardware but terrible for human perception. Two colors that are numerically “equidistant” in RGB can look wildly different to the eye.
Perceptual spaces such as OKLab and OKLCH reduce this mismatch. Operations like blending, lightening, and interpolation are usually more consistent than RGB component arithmetic, while endpoint choice, gamut mapping, viewing conditions, and individual observers still matter.
Note
OKLab and OKLCH are two coordinate views of the same underlying model, not two
competing construction rules. Think of the model as a map: OKLab’s a and b
are rectangular map axes, while OKLCH converts those axes into distance from
the center C and angle h.
Tip
If you’re new to color spaces, don’t worry about the math — dartwork-mpl handles all conversions automatically. Just pick the constructor that matches your input format, and use OKLCH when you need to adjust hue or saturation.
Color object
The Color class is a unified interface for working with colors across
multiple color spaces. Internally, colors are stored as OKLab coordinates,
which enables efficient and accurate conversions.
import dartwork_mpl as dm

# All Color objects are stored internally as OKLab
color = dm.oklab(0.7, 0.1, 0.2)
print(color)  # Color(oklab=(0.7000, 0.1000, 0.2000))
View objects (color.oklab, color.oklch, color.rgb) provide
convenient attribute-based access for reading, writing, unpacking, and
indexing color components.
Creating Color objects
You can create Color objects from any supported format. Pick whichever matches
your input — all methods produce identical Color instances that can be
freely converted.
From OKLab coordinates
import dartwork_mpl as dm

# L: lightness (0–1), a: green↔red, b: blue↔yellow
color = dm.oklab(0.7, 0.1, 0.2)
From OKLCH coordinates
import dartwork_mpl as dm

# L: lightness (0–1), C: chroma (≥0), h: hue in degrees (0–360)
color = dm.oklch(0.7, 0.2, 120)  # Greenish color
OKLCH uses degrees for hue, making it intuitive: 0° = red, 120° = green, 240° = blue. This is the most natural space for adjusting saturation (chroma) and hue independently.
From RGB values
import dartwork_mpl as dm

# Automatically detects range: 0–1 or 0–255
color1 = dm.rgb(0.8, 0.2, 0.3)    # 0–1 range (common in matplotlib)
color2 = dm.rgb(200, 50, 75)      # 0–255 range (auto-detected)
From hex strings
import dartwork_mpl as dm

color1 = dm.hex("#ff5733")
color2 = dm.hex("#f73")  # Short format also supported
From matplotlib color names
import dartwork_mpl as dm

# Works with any matplotlib color name
color1 = dm.color("red")
color2 = dm.color("dc.teal2")      # dartwork Color palette
color3 = dm.color("tw.blue500")    # Tailwind colors
Color space conversion
Once you have a Color object, convert it to any supported space. Pick the method that suits your workflow.
Using conversion methods
import dartwork_mpl as dm

color = dm.hex("#ff5733")

# Returns tuples
L, a, b = color.to_oklab()        # OKLab coordinates
L, C, h = color.to_oklch()        # OKLCH (h in degrees)
r, g, b = color.to_rgb()          # RGB (0–1 range)
hex_str = color.to_hex()          # Hex string
Using view objects (recommended)
View objects provide attribute-based access with both reading and writing:
import dartwork_mpl as dm

color = dm.hex("#ff5733")

# Attribute access
L = color.oklab.L
a = color.oklab.a

# Unpacking
L, a, b = color.oklab
L, C, h = color.oklch
r, g, b = color.rgb

# Index access
a = color.oklab[1]  # Same as color.oklab.a
Try it live: Pick any color below to see its values across all four color spaces in real time.
### Modifying color componentsView objects support direct modification — changes in any space are automatically synced back to the internal OKLab representation:
import dartwork_mpl as dm

color = dm.oklab(0.7, 0.1, 0.2)

# Direct assignment
color.oklab.L = 0.8

# Arithmetic operations
color.oklab.L += 0.1    # Increase lightness
color.oklab.a -= 0.05   # Shift toward green

# OKLCH modifications (most intuitive for designers)
color.oklch.C += 0.1    # More saturated
color.oklch.h += 30     # Rotate hue by 30°

# RGB modifications
color.rgb.r = 0.9       # Set red channel
Copying colors
Use copy() to create an independent clone. Without it, modifications would
affect the original:
import dartwork_mpl as dm

color = dm.oklch(0.7, 0.2, 120)
brighter = color.copy()
brighter.oklab.L += 0.1  # original is unchanged

print(color.oklab.L)      # 0.7
print(brighter.oklab.L)   # 0.8
Color space overview
Space |
Type |
Components |
Best for |
|---|---|---|---|
OKLab |
Cartesian |
L (lightness), a, b |
Blending, interpolation, color math |
OKLCH |
Polar |
L, C (chroma), h (hue°) |
Adjusting saturation/hue independently |
RGB |
Device |
r, g, b (0–1) |
Display output, matplotlib compatibility |
Hex |
String |
|
CSS, web, copy-paste |
Tip
When should I use which?
OKLCH for creative work — it’s the most intuitive for adjusting how vivid (chroma) or what shade (hue) a color is.
OKLab for programmatic operations — blending, distance calculations, and interpolation.
RGB/Hex mainly for output — passing colors to matplotlib or the web.
Color interpolation with cspace
The cspace() function generates smooth color gradients by interpolating
between two colors in a specified color space. Think of it as np.linspace
for colors.
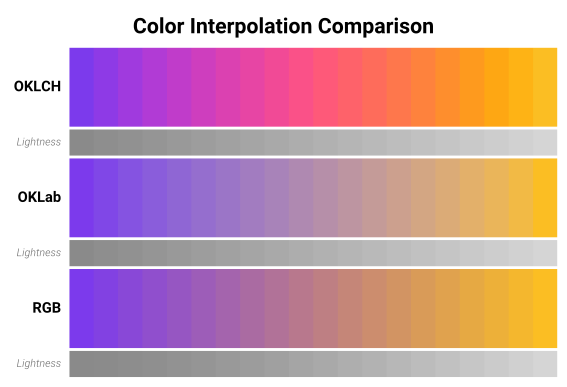
Why does the color space matter? Try the demo below with the default purple → yellow pair. Notice how:
RGB produces a muddy gray-brown in the middle (the “dead zone”)
OKLab stays smooth but can look washed out
OKLCH maintains vivid hues throughout — it takes the scenic route around the color wheel
import dartwork_mpl as dm

dm.style.use("scientific")

# Interpolate in OKLCH (default perceptual path)
colors_oklch = dm.cspace("#ff5733", "#33ff57", n=10, space="oklch")

# Interpolate in OKLab
colors_oklab = dm.cspace("#ff5733", "#33ff57", n=10, space="oklab")

# Interpolate in RGB (often produces muddy midpoints)
colors_rgb = dm.cspace("#ff5733", "#33ff57", n=10, space="rgb")
The function accepts Color objects or hex strings:
import dartwork_mpl as dm

start = dm.color("dc.teal2")
end = dm.hex("#ff5733")
gradient = dm.cspace(start, end, n=20, space="oklch")
Creating custom colormaps
Use cspace() to build custom matplotlib colormaps with smooth OKLab/OKLCH
paths. This often avoids the muddy midpoint of RGB component interpolation.
Technical detail
Unlike the shipped dc.* catalog, arbitrary custom endpoints are not
automatically gated for ΔEOK variation, modeled-relative-Y topology, ΔE00, or
CVD.
See Validation for the shipped checks and validation workflow.
Try it live: Build your own colormap below. Toggle between Sequential and Diverging modes, pick your colors, and copy the generated Python code.
colors = dm.cspace("#1A237E", "#FF6F00", n=256, space="oklch")Sequential colormaps
A sequential colormap ramps from one color to another — ideal for magnitude, density, or probability maps:
import dartwork_mpl as dm
import matplotlib.pyplot as plt
import matplotlib.colors as mcolors
import numpy as np

dm.style.use("scientific")

# Create a custom sequential colormap
colors = dm.cspace("#1a237e", "#ff6f00", n=256, space="oklch")
cmap = mcolors.ListedColormap([c.to_rgb() for c in colors],
                               name="custom_blue_orange")

# Use it in a plot
fig, ax = plt.subplots(figsize=dm.figsize("15cm", "9cm"))
data = np.random.randn(100, 100)
im = ax.imshow(data, cmap=cmap)
plt.colorbar(im, ax=ax, label="Value")
dm.simple_layout(fig)
Diverging colormaps
For data with a meaningful midpoint (e.g., positive vs. negative), create a diverging colormap by interpolating through a neutral center:
import dartwork_mpl as dm
import matplotlib.colors as mcolors

# Diverging: blue → white → red
colors1 = dm.cspace("#1a237e", "#ffffff", n=128, space="oklch")
colors2 = dm.cspace("#ffffff", "#c62828", n=128, space="oklch")
colors = colors1[:-1] + colors2  # Remove duplicate white
cmap_div = mcolors.ListedColormap([c.to_rgb() for c in colors],
                                   name="custom_diverging")
Registering colormaps
To make your custom colormap available globally in your session:
import matplotlib as mpl

mpl.colormaps.register(cmap=cmap)
# Now you can use it anywhere: plt.imshow(data, cmap="custom_blue_orange")
Quick reference
Task |
Code |
|---|---|
Create from OKLab |
|
Create from OKLCH |
|
Create from RGB |
|
Create from hex |
|
Create from name |
|
Convert to tuple |
|
Convert to hex |
|
Read/write components |
|
Copy |
|
Interpolate |
|
See also
Colors — full named color-token catalog
Palettes — discrete forms for series color
Colormaps — predefined colormap collections
Design rationale — why the color system is built this way
Usage Guide › Colors — practical color usage and mixing
API › Color Utilities for all color functions