Note
Go to the end to download the full example code.
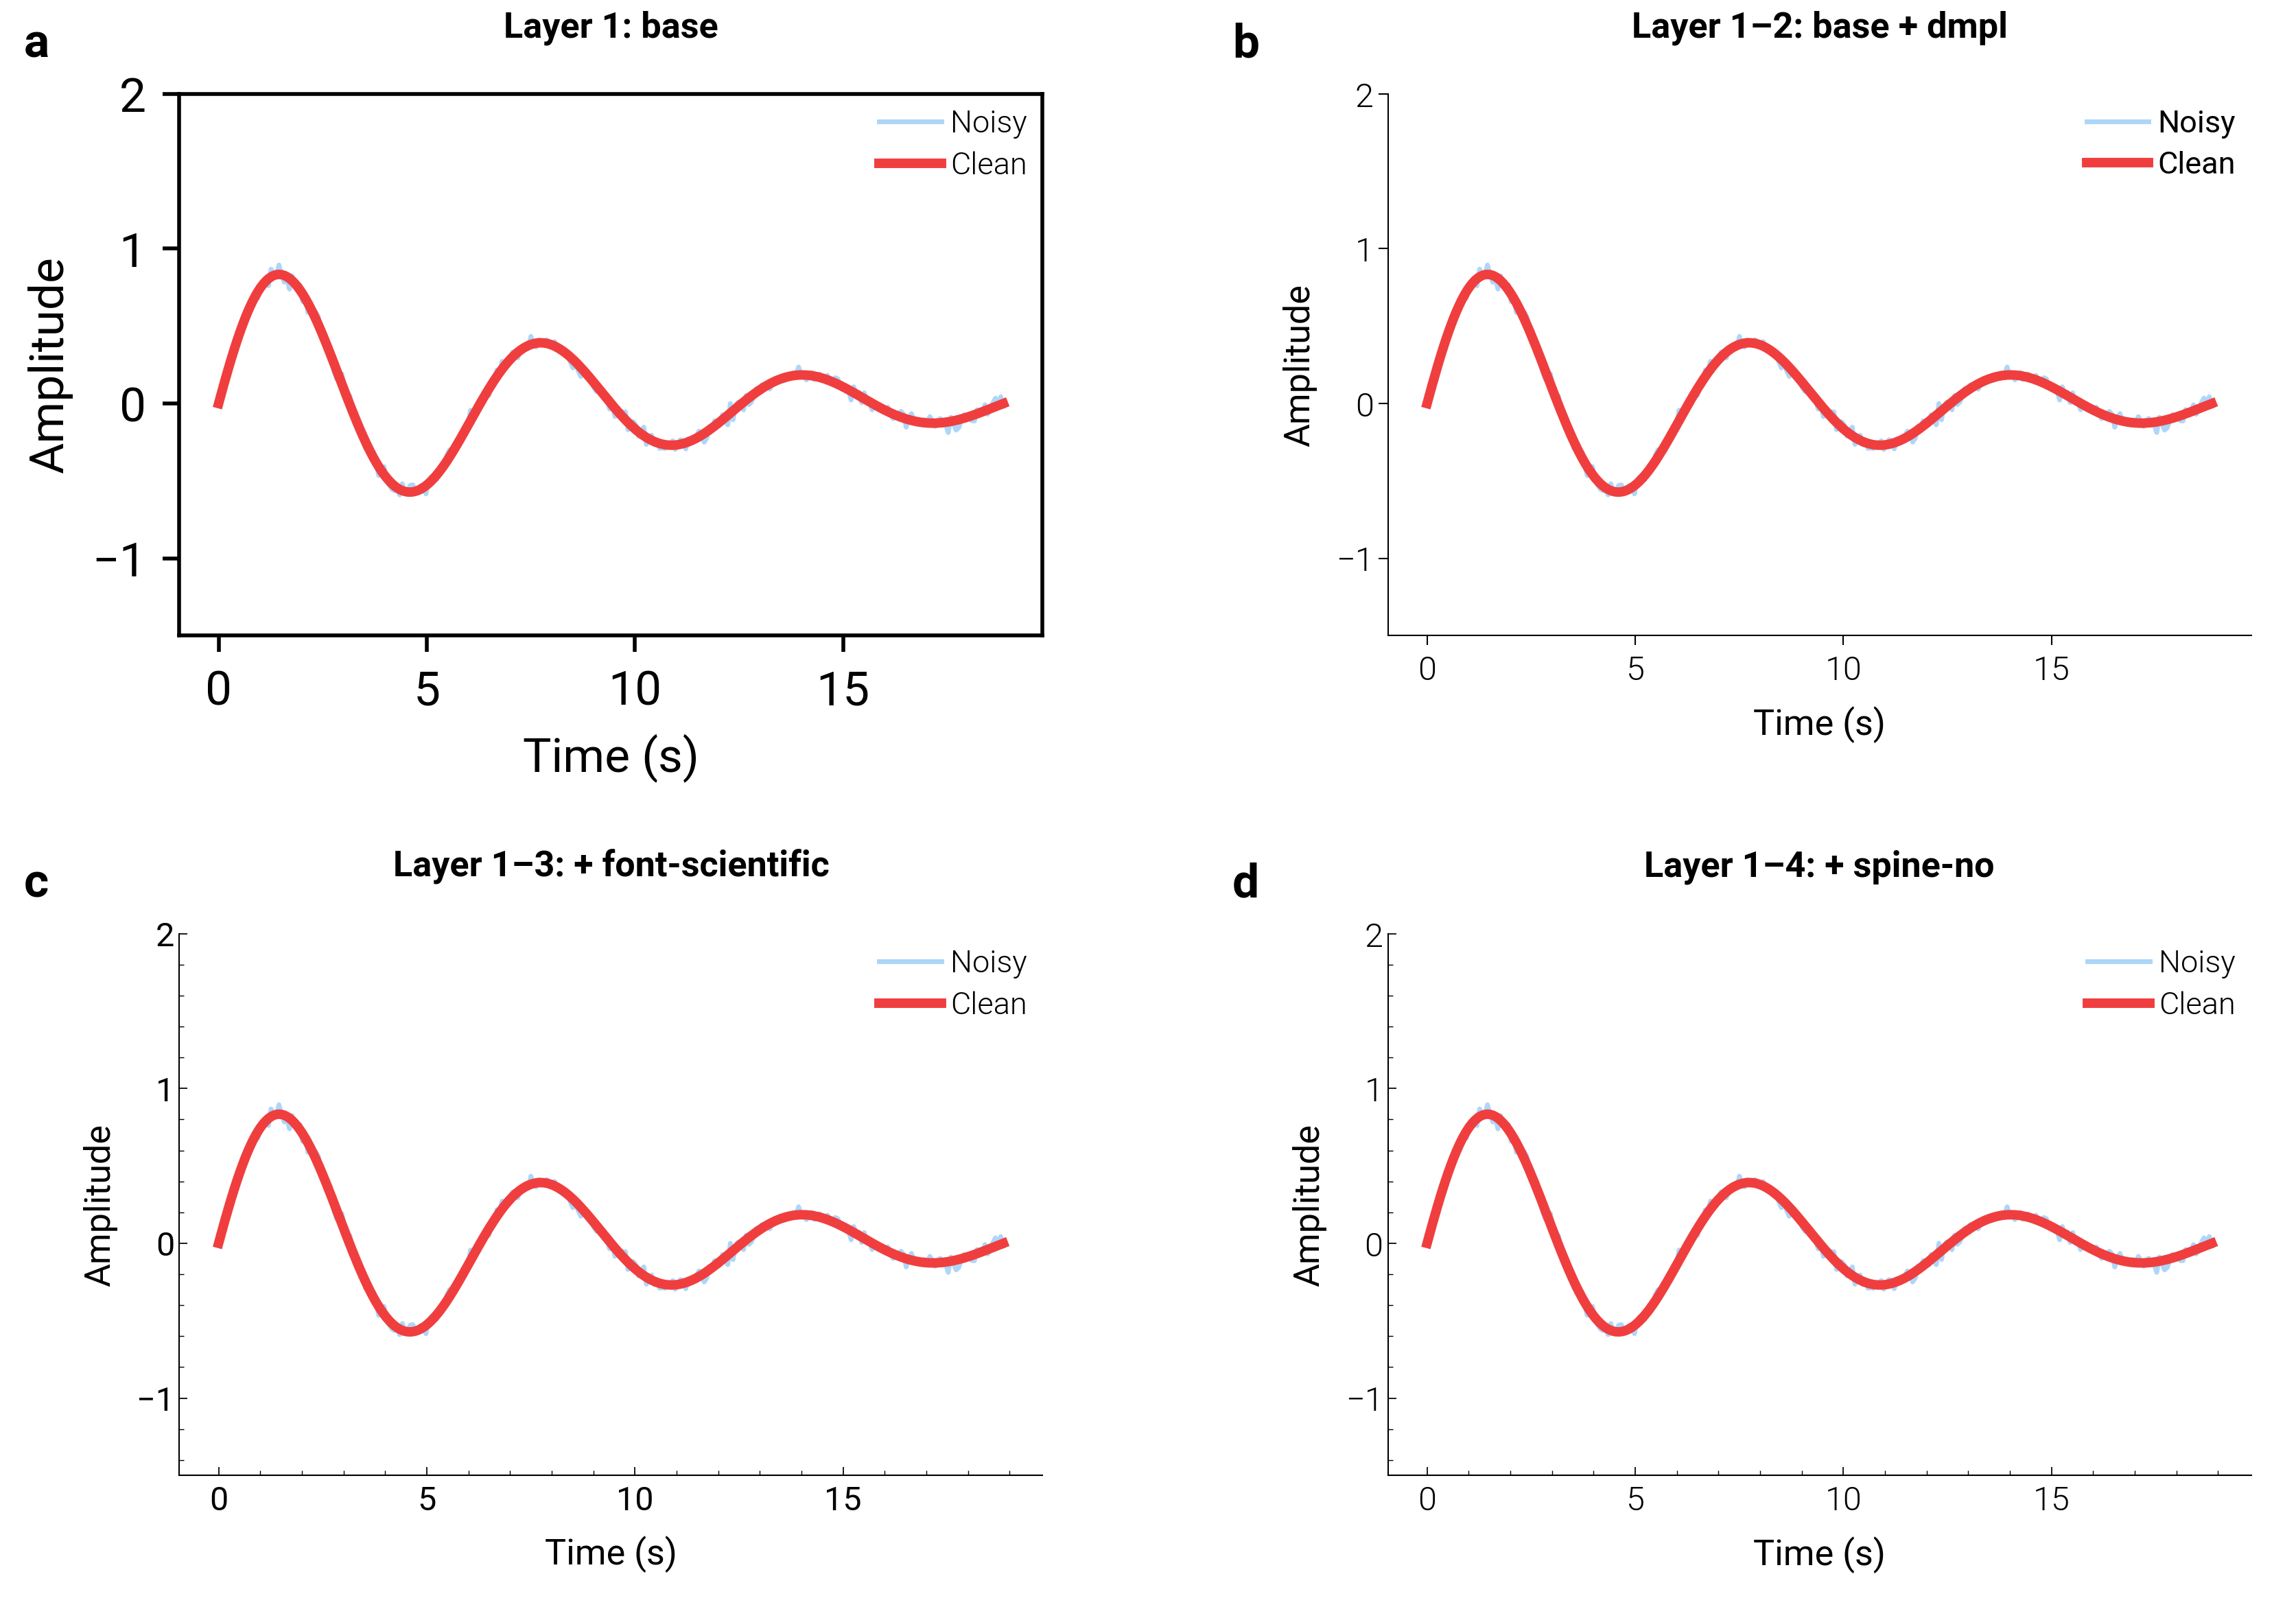
Style Stacking & Compositing
dartwork-mpl styles are composable layers, not monolithic themes.
dm.style.stack() applies multiple .mplstyle files sequentially —
later layers override earlier ones, giving you fine-grained control over
base geometry, font scaling, spine visibility, and color themes.
This example visualizes four progressive stacking stages on the same damped-oscillation dataset.
import matplotlib.gridspec as gridspec
import matplotlib.pyplot as plt
import numpy as np

import dartwork_mpl as dm

# Shared dataset — damped oscillation
np.random.seed(7)
t = np.linspace(0, 6 * np.pi, 300)
signal = np.exp(-0.12 * t) * np.sin(t)
noise = np.random.normal(0, 0.03, len(t))

# Four stacking stages to visualize
stages = [
    (["base"], "Layer 1: base"),
    (["base", "dmpl"], "Layer 1\u20132: base + dmpl"),
    (["base", "dmpl", "font-scientific"], "Layer 1\u20133: + font-scientific"),
    (
        ["base", "dmpl", "font-scientific", "spine-no"],
        "Layer 1\u20134: + spine-no",
    ),
]

fig = plt.figure(figsize=dm.figsize("17cm", "wide"))
gs = gridspec.GridSpec(2, 2, figure=fig, hspace=0.55, wspace=0.40)

for idx, (layers, title) in enumerate(stages):
    ax = fig.add_subplot(gs[idx // 2, idx % 2])
    dm.style.stack(layers)
    ax.plot(
        t,
        signal + noise,
        color="dc.ocean2",
        lw=dm.lw(0),
        alpha=0.4,
        label="Noisy",
    )
    ax.plot(t, signal, color="dc.vivid3", lw=dm.lw(1), label="Clean")
    ax.set_title(title, fontsize=dm.fs(0), weight="bold", pad=12)
    ax.set_xlabel("Time (s)")
    ax.set_ylabel("Amplitude")
    ax.set_ylim(-1.5, 2.0)
    ax.legend(loc="upper right", fontsize=dm.fs(-1), frameon=False)

# Reset to presentation for the panel labels
dm.style.use("presentation")
dm.label_axes(fig.axes)
dm.simple_layout(fig)
plt.show()
Total running time of the script: (0 minutes 2.106 seconds)