Real-World Dashboards
This gallery showcases complete, production-ready dashboard examples that combine multiple dartwork-mpl features — composite layouts, semantic colors, hierarchical typography, and auto-layout — on realistic sample data.
Each example focuses on one chart in one figure so that the techniques are easy to isolate, remix, and drop into a larger multi-panel report.
Example Domain
All examples in this gallery render a consistent synthetic dataset: a small fleet of environmental sensors reporting temperature, humidity, and power draw at several sites over time. The choice of domain is incidental — the visual patterns (dual-axis trends, stacked components, threshold overlays, grouped comparisons, summary cards) transfer directly to any time series or categorical data.
Techniques Demonstrated
Composite dashboards: plt.figure + GridSpec for multi-panel layouts
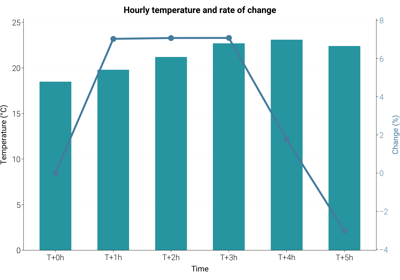
Dual-axis time series: bar + line on shared x-axis with a secondary y-axis
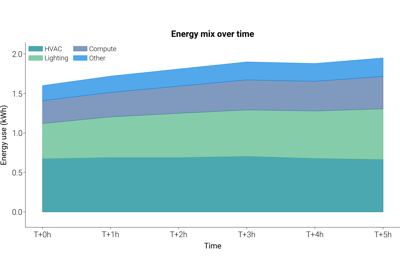
Stacked area charts: component mix over time
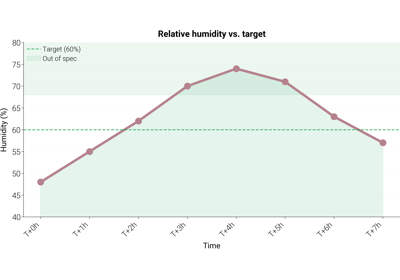
Threshold-annotated trends: reference lines and shaded bands
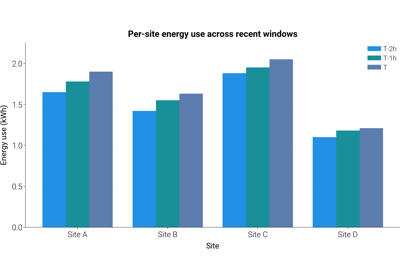
Grouped bar comparisons: side-by-side categories across periods
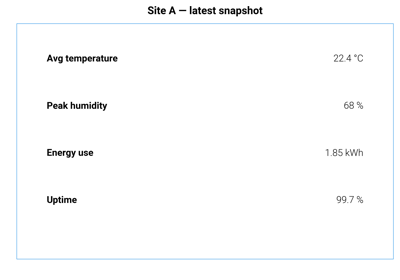
Text-only summary cards: axis(“off”) + ax.text for KPI tiles
Conventions
All dashboards follow dartwork-mpl conventions:
Preset styles:
dm.style.use("report")(or"report-kr"for Korean copy) is applied before any figure is created.Relative typography: titles and labels use
dm.fs(n)so that a preset change rescales the whole figure uniformly.Named colors: charts pull from the
oc.*andtw.*palettes instead of raw hex strings.Auto-layout:
dm.simple_layout(fig)is called beforeplt.showso that margins adapt to actual content rather than static values.Single chart per file: each example renders exactly one figure. To assemble a multi-panel dashboard, compose the individual snippets inside a single GridSpec.