Note
Go to the end to download the full example code.
Twin Axis (Advanced)
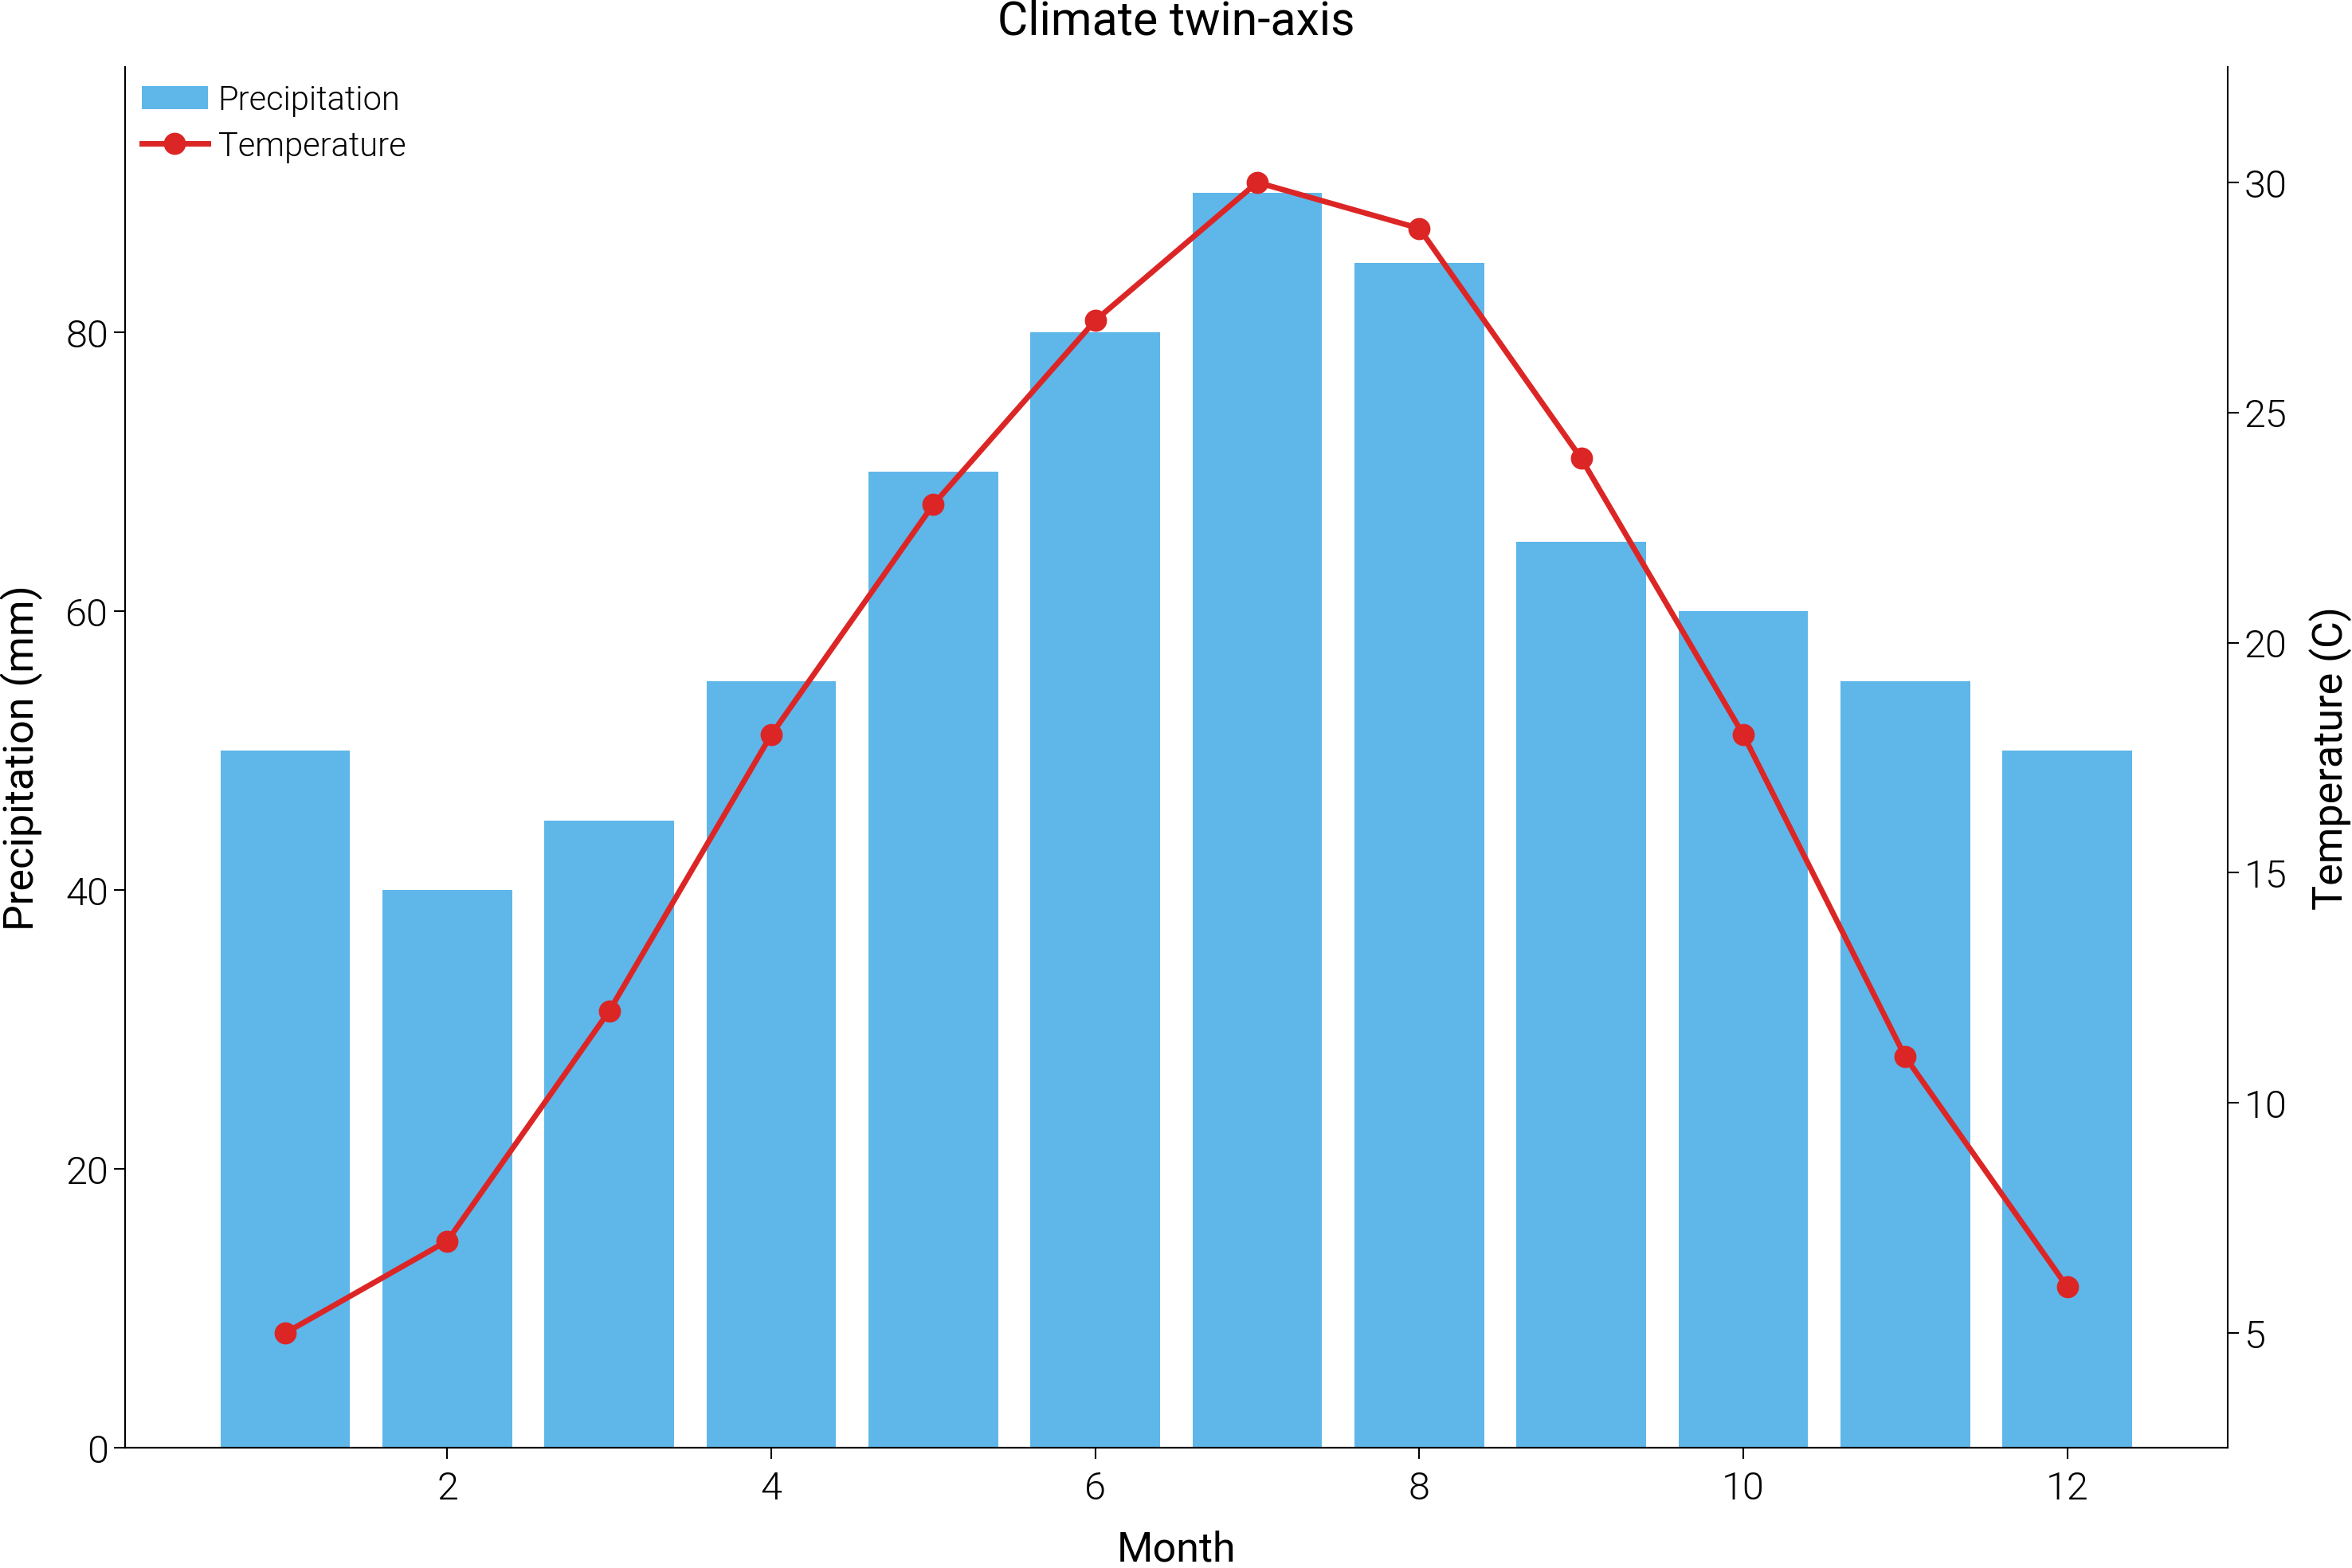
Twin axis — advanced template (price + volume with color-coded axes).
Source: dartwork_mpl/asset/prompt/05-templates/advanced/twin_axis.py ·
MCP dartwork-mpl://template/advanced/twin_axis.
[VISUAL] 💡 UNIT_DUP: Y-axis[1]: 축 라벨이 단위를 선언했는데 틱에 별도 접미 존재 (label unit='shares', tick suffix='k'). Fix: 단위는 축 라벨에만; 틱은 순수 숫자 포맷터
[VISUAL] ⚠️  CROSS_AXES_OVERLAP: axes[0] xtick '0' overlaps axes[1] xtick '0' (intersection/min-area=1.00). Increase GridSpec hspace/wspace or pass gridspec_kw={'hspace': ..., 'wspace': ...}.
[VISUAL] ⚠️  TEXT_CONTRAST: Text contrast 1.92:1 is below the 4.5:1 AA threshold for normal text (sample: 'Target = $115')
[VISUAL] 💡 TEXT_CONTRAST: Text contrast 3.32:1 is below the 4.5:1 AA threshold for normal text (sample: 'Synthetic 90-day series — axis colors...')
[VISUAL] ⚠️  TEXT_CONTRAST: Text contrast 2.16:1 is below the 4.5:1 AA threshold for normal text across 12 text items (sample: 'Price ($)')
[VISUAL] ⚠️  TEXT_CONTRAST: Text contrast 2.07:1 is below the 4.5:1 AA threshold for normal text across 12 text items (sample: 'Volume (shares)')
[VISUAL] 💡 GRAYSCALE_SAFETY: The project modeled-relative-Y proximity heuristic before compositing found source-RGB pairs below its ΔY threshold; inspect ΔEOK separation: #00c897/#ffa926

=== FIX SUGGESTIONS ===

UNIT_DUP: Y-axis[1]: 축 라벨이 단위를 선언했는데 틱에 별도 접미 존재 (label unit='shares', tick suffix='k'). Fix: 단위는 축 라벨에만; 틱은 순수 숫자 포맷터
  Option 1:
    # Keep the unit in the axis label only
    ax.yaxis.set_major_formatter(mticker.PercentFormatter(symbol=''))
  Option 2:
    # Or use a bare numeric formatter
    ax.yaxis.set_major_formatter(mticker.StrMethodFormatter('{x:g}'))
[VISUAL] 💡 UNIT_DUP: Y-axis[1]: 축 라벨이 단위를 선언했는데 틱에 별도 접미 존재 (label unit='shares', tick suffix='k'). Fix: 단위는 축 라벨에만; 틱은 순수 숫자 포맷터
[VISUAL] ⚠️  CROSS_AXES_OVERLAP: axes[0] xtick '0' overlaps axes[1] xtick '0' (intersection/min-area=1.00). Increase GridSpec hspace/wspace or pass gridspec_kw={'hspace': ..., 'wspace': ...}.
[VISUAL] ⚠️  TEXT_CONTRAST: Text contrast 1.92:1 is below the 4.5:1 AA threshold for normal text (sample: 'Target = $115')
[VISUAL] 💡 TEXT_CONTRAST: Text contrast 3.32:1 is below the 4.5:1 AA threshold for normal text (sample: 'Synthetic 90-day series — axis colors...')
[VISUAL] ⚠️  TEXT_CONTRAST: Text contrast 2.16:1 is below the 4.5:1 AA threshold for normal text across 12 text items (sample: 'Price ($)')
[VISUAL] ⚠️  TEXT_CONTRAST: Text contrast 2.07:1 is below the 4.5:1 AA threshold for normal text across 12 text items (sample: 'Volume (shares)')
[VISUAL] 💡 GRAYSCALE_SAFETY: The project modeled-relative-Y proximity heuristic before compositing found source-RGB pairs below its ΔY threshold; inspect ΔEOK separation: #00c897/#ffa926
# ai-template-meta-start
# tier: advanced
# basic_counterpart: twin_axis
# use_case: Two-y-scale chart (price + volume) with each axis color-coded to its data
# difficulty: advanced
# data_shape: x: list[float], y_price: list[float], y_volume: list[float]
# tags: twin-axis, price-volume, color-coded, narrative
# narrative: Daily price + volume; price target axhline on the left axis
# advanced_apis: ax.twinx, color-coded axis labels and tick colors, axhline target, no chart-junk
# ai-template-meta-end

import matplotlib.pyplot as plt
import numpy as np

import dartwork_mpl as dm

dm.style.use("scientific")

rng = np.random.default_rng(42)
n = 90
days = np.arange(n)
price = 100 + np.cumsum(rng.normal(0.18, 0.9, size=n))
volume = (
    rng.lognormal(mean=6.0, sigma=0.35, size=n) * (1 + 0.2 * np.sin(days / 8))
).astype(int)
target = 115.0

price_color = dm.color("dc.teal5").to_hex()
vol_color = dm.color("oc.gray5").to_hex()

fig, ax_price = plt.subplots(figsize=dm.figsize("15cm", "standard"))
ax_vol = ax_price.twinx()

# Volume — drawn behind, lighter.
ax_vol.bar(
    days,
    volume,
    color=vol_color,
    edgecolor="white",
    linewidth=0.2,
    alpha=0.55,
    zorder=1,
)
ax_vol.set_ylabel("Volume (shares)", color=vol_color)
ax_vol.tick_params(axis="y", colors=vol_color)
dm.format_axis_si(ax_vol, axis="y")
ax_vol.set_ylim(0, volume.max() * 2.0)  # squeeze bars into the bottom third

# Price — drawn on top.
ax_price.plot(days, price, color=price_color, linewidth=dm.lw(0), zorder=3)
ax_price.set_ylabel("Price ($)", color=price_color)
ax_price.tick_params(axis="y", colors=price_color)
ax_price.set_zorder(ax_vol.get_zorder() + 1)
ax_price.patch.set_visible(False)  # transparent so volume bars show

# Target axhline.
ax_price.axhline(
    target, color="dc.amber5", linewidth=0.5, linestyle="--", zorder=2
)
ax_price.text(
    n - 1,
    target + 0.6,
    f"Target = ${target:.0f}",
    ha="right",
    va="bottom",
    fontsize=dm.fs(-1),
    color="dc.amber5",
    fontstyle="italic",
)

ax_price.set_xlabel("Trading day")
ax_price.set_xlim(0, n - 1)

ax_price.set_title(
    "Price closes the gap to the $115 target on rising volume",
    fontsize=dm.fs(1),
    fontweight=dm.fw(1),
    loc="left",
    pad=18,
)
ax_price.text(
    0.0,
    1.02,
    "Synthetic 90-day series — axis colors track their series.",
    transform=ax_price.transAxes,
    ha="left",
    va="bottom",
    fontsize=dm.fs(-1),
    color="oc.gray6",
)

fig.text(
    0.01,
    0.005,
    "Source: synthetic price + volume series (rng seed 42).",
    fontsize=dm.fs(-2),
    color="oc.gray5",
    ha="left",
    va="bottom",
)

dm.simple_layout(fig, margin=dm.inch(0.12))
dm.validate_with_fixes(fig)

issues = dm.check_figure_quality(fig)
issues = [i for i in issues if "Missing" not in i]
if issues:
    print(f"[twin_axis-advanced] quality issues: {issues}")

dm.save_formats(fig, "twin_axis_advanced")
Total running time of the script: (0 minutes 0.866 seconds)