Note
Go to the end to download the full example code.
Small Multiples (Advanced)
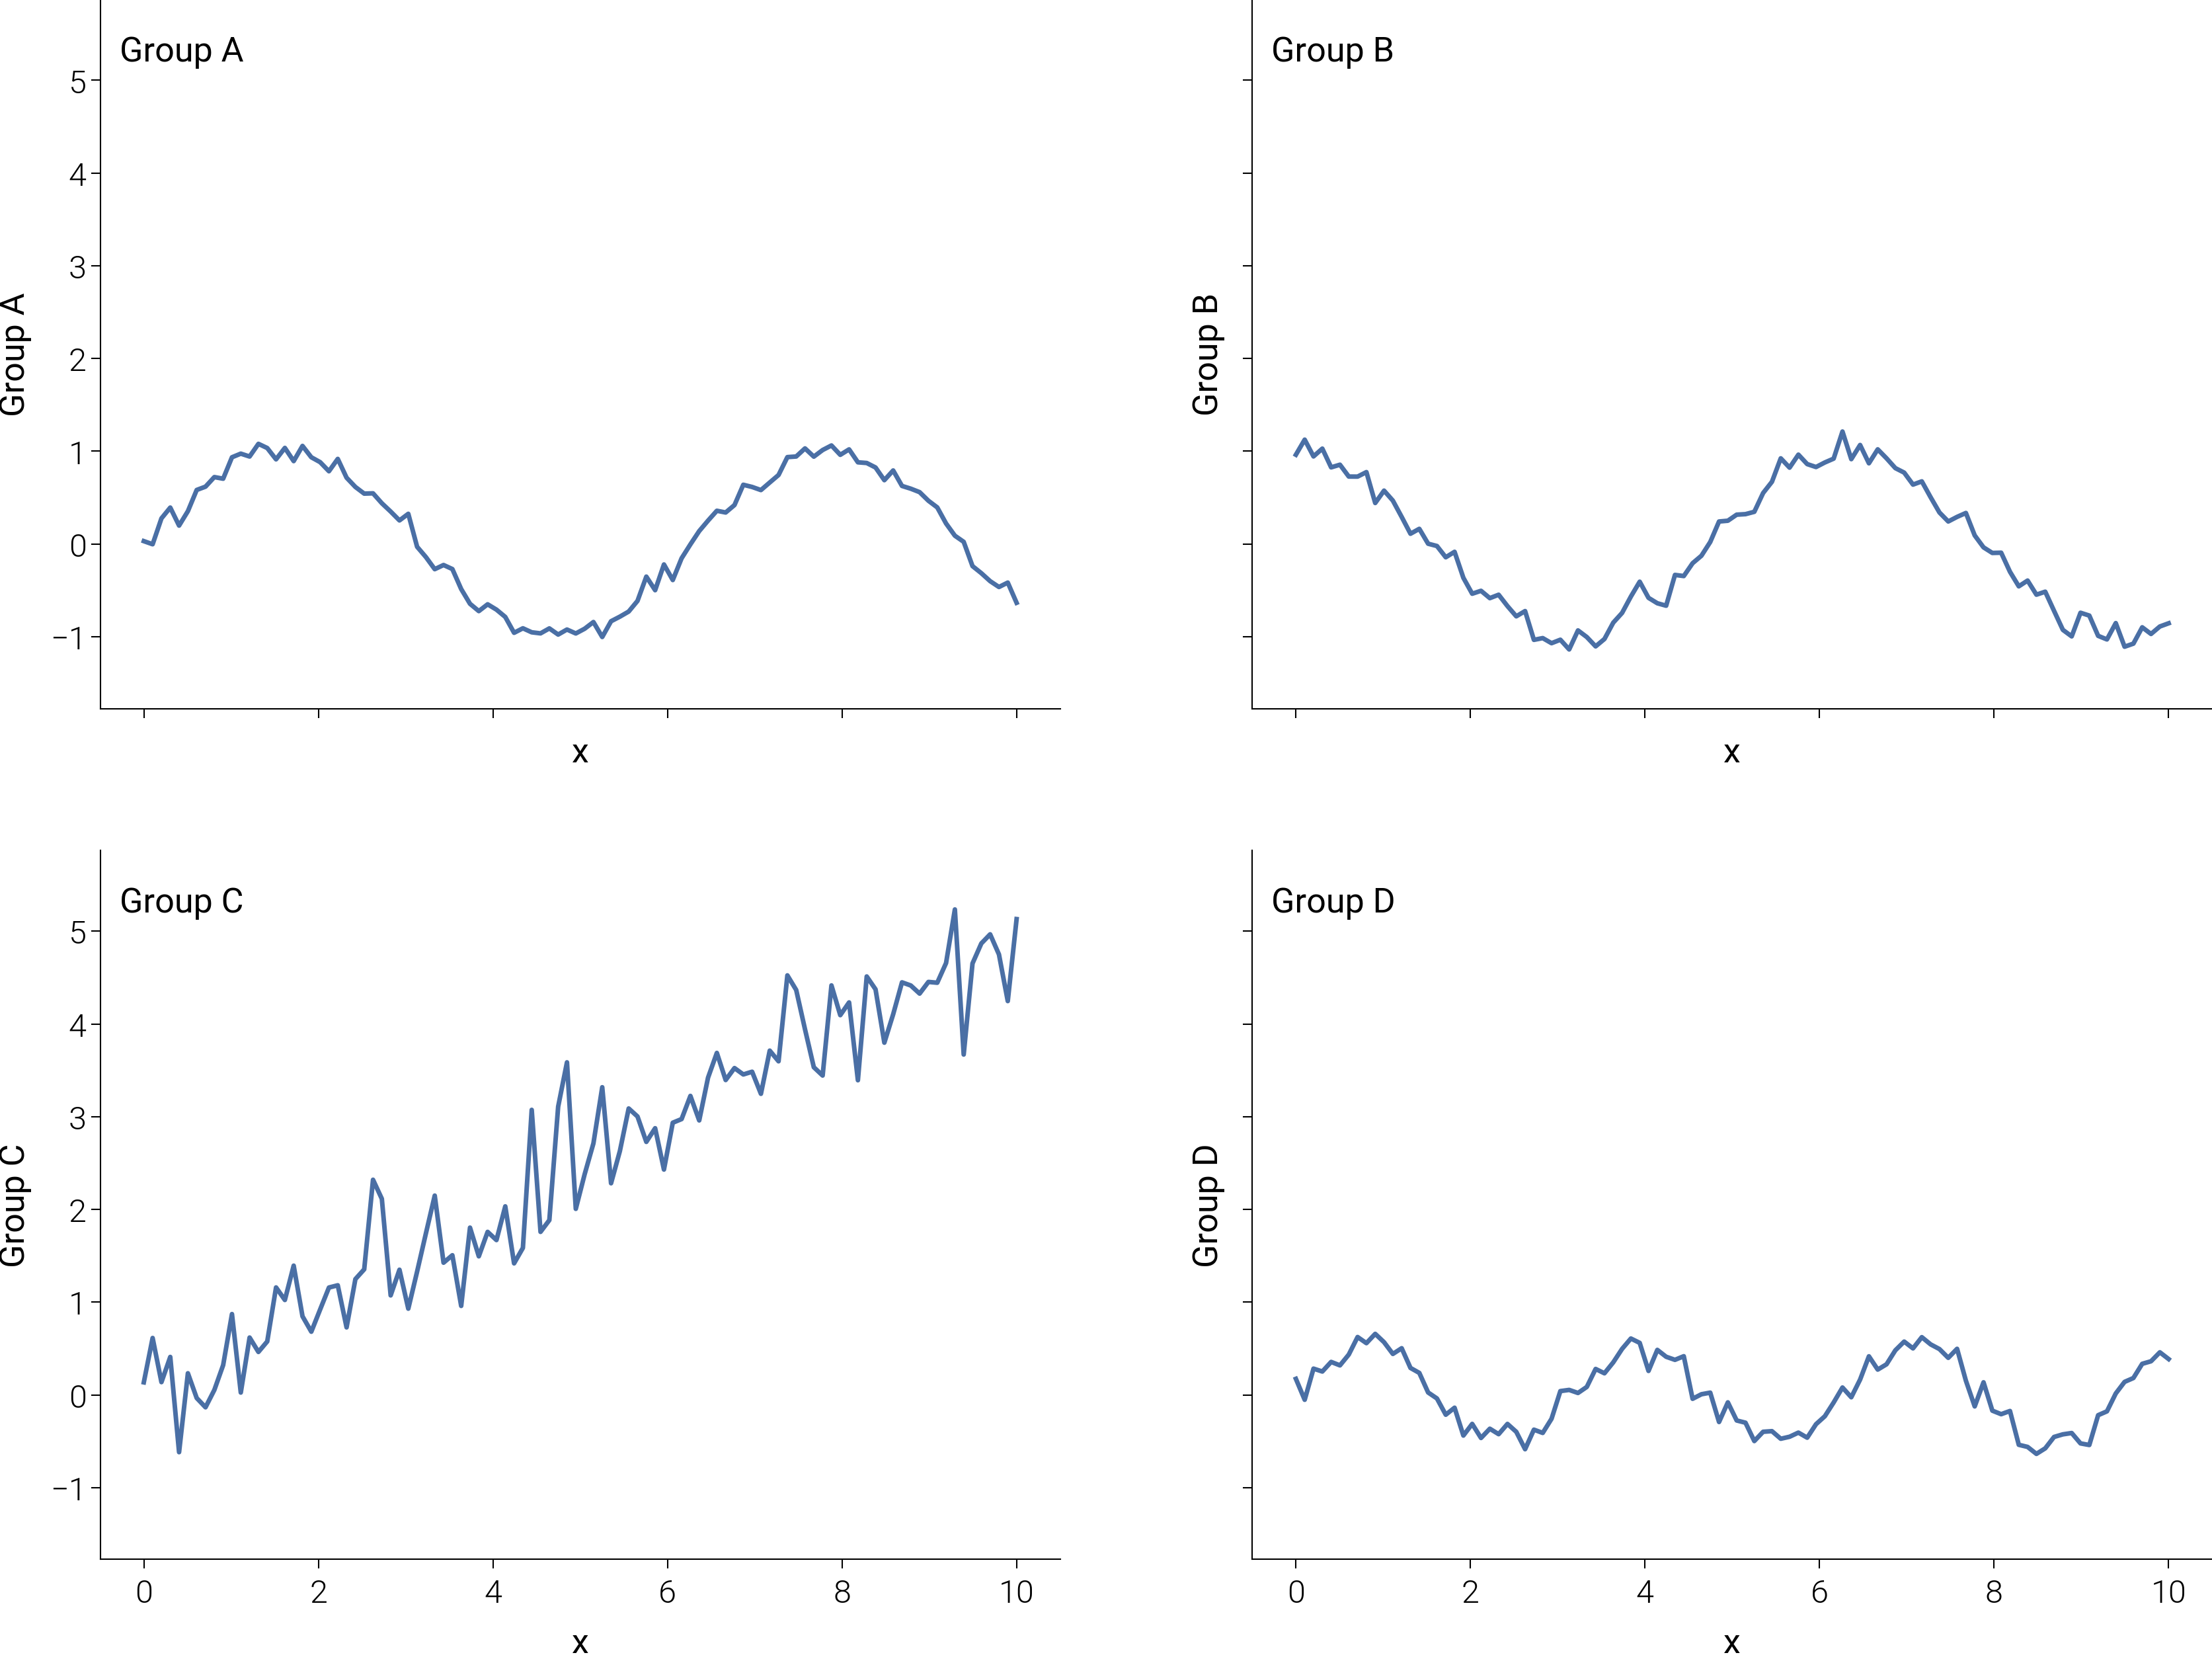
Small multiples — advanced template (6 panels + label_axes + shared y).
Source: dartwork_mpl/asset/prompt/05-templates/advanced/small_multiples.py ·
MCP dartwork-mpl://template/advanced/small_multiples.
[VISUAL] ⚠️  TEXT_CONTRAST: Text contrast 2.16:1 is below the 4.5:1 AA threshold for normal text (sample: 'Δ +13')
[VISUAL] ⚠️  TEXT_CONTRAST: Text contrast 1.91:1 is below the 4.5:1 AA threshold for normal text (sample: 'Δ +33')
[VISUAL] ⚠️  TEXT_CONTRAST: Text contrast 1.71:1 is below the 4.5:1 AA threshold for normal text (sample: 'Δ +0')
[VISUAL] ⚠️  TEXT_CONTRAST: Text contrast 1.54:1 is below the 4.5:1 AA threshold for normal text (sample: 'Δ -10')
[VISUAL] ⚠️  TEXT_CONTRAST: Text contrast 1.38:1 is below the 4.5:1 AA threshold for normal text (sample: 'Δ +19')
[VISUAL] ⚠️  TEXT_CONTRAST: Text contrast 1.24:1 is below the 4.5:1 AA threshold for normal text (sample: 'Δ +51')

=== FIX SUGGESTIONS ===
[VISUAL] ⚠️  TEXT_CONTRAST: Text contrast 2.16:1 is below the 4.5:1 AA threshold for normal text (sample: 'Δ +13')
[VISUAL] ⚠️  TEXT_CONTRAST: Text contrast 1.91:1 is below the 4.5:1 AA threshold for normal text (sample: 'Δ +33')
[VISUAL] ⚠️  TEXT_CONTRAST: Text contrast 1.71:1 is below the 4.5:1 AA threshold for normal text (sample: 'Δ +0')
[VISUAL] ⚠️  TEXT_CONTRAST: Text contrast 1.54:1 is below the 4.5:1 AA threshold for normal text (sample: 'Δ -10')
[VISUAL] ⚠️  TEXT_CONTRAST: Text contrast 1.38:1 is below the 4.5:1 AA threshold for normal text (sample: 'Δ +19')
[VISUAL] ⚠️  TEXT_CONTRAST: Text contrast 1.24:1 is below the 4.5:1 AA threshold for normal text (sample: 'Δ +51')
# ai-template-meta-start
# tier: advanced
# basic_counterpart: small_multiples
# use_case: Same KPI trend across 6 product lines with panel IDs (a)-(f) and a shared y-axis
# difficulty: advanced
# data_shape: groups: dict[str, list[float]], x: list[float]
# tags: small-multiples, panel-ids, shared-axes, narrative
# narrative: 24-month KPI trend across 6 product lines; sharey reveals the relative wins
# advanced_apis: plt.subplots(2, 3, sharey=True), dm.label_axes for (a)-(f), per-panel sub-title, fig.supxlabel/supylabel
# ai-template-meta-end

import matplotlib.pyplot as plt
import numpy as np

import dartwork_mpl as dm

dm.style.use("scientific")

rng = np.random.default_rng(42)
months = np.arange(24)

# Six product lines with different growth profiles.
lines = {
    "Line A": 50 + 0.6 * months + rng.normal(0, 1.2, 24),
    "Line B": 50 + 1.4 * months + rng.normal(0, 1.5, 24),
    "Line C": 50 + 0.1 * months + rng.normal(0, 1.0, 24),
    "Line D": 60 - 0.4 * months + rng.normal(0, 1.6, 24),  # declining
    "Line E": 50 + 0.8 * months + rng.normal(0, 1.0, 24),
    "Line F": 50 + 2.1 * months + rng.normal(0, 2.0, 24),  # rocket
}

gradient = dm.cspace("dc.teal5", "dc.teal1", n=len(lines))
colors = [c.to_hex() for c in gradient]

fig, axes = plt.subplots(
    2, 3, figsize=dm.figsize("17cm", "wide"), sharex=True, sharey=True
)
axes_flat = axes.flatten()

for i, (name, vals) in enumerate(lines.items()):
    ax = axes_flat[i]
    ax.plot(months, vals, color=colors[i], linewidth=dm.lw(0))
    ax.fill_between(months, vals, vals.min(), color=colors[i], alpha=0.08)
    ax.set_title(
        name, loc="left", fontsize=dm.fs(0), fontweight=dm.fw(1), pad=4
    )
    # Per-panel takeaway: total growth.
    delta = vals[-1] - vals[0]
    ax.text(
        0.96,
        0.06,
        f"Δ {delta:+.0f}",
        transform=ax.transAxes,
        ha="right",
        va="bottom",
        fontsize=dm.fs(-1),
        color=colors[i],
        fontweight=dm.fw(1),
    )

# Panel IDs (a)-(f) via the dartwork helper (as the template advertises)
# rather than hand-formatted into each title.
dm.label_axes(axes_flat)

# Shared axis labels.
fig.supxlabel("Month after launch", fontsize=dm.fs(0), y=0.04)
fig.supylabel("KPI (indexed to 50)", fontsize=dm.fs(0), x=0.04)

fig.suptitle(
    "Line F outruns the pack while Line D bleeds out",
    fontsize=dm.fs(1),
    fontweight=dm.fw(1),
    x=0.04,
    y=0.985,
    ha="left",
)
fig.text(
    0.04,
    0.945,
    "Six product lines, 24 months — shared y-axis exposes the relative speeds.",
    fontsize=dm.fs(-1),
    color="oc.gray6",
    ha="left",
)

fig.text(
    0.01,
    0.005,
    "Source: synthetic product-line KPI panel (rng seed 42).",
    fontsize=dm.fs(-2),
    color="oc.gray5",
    ha="left",
    va="bottom",
)

fig.subplots_adjust(
    left=0.08, right=0.97, top=0.86, bottom=0.10, wspace=0.10, hspace=0.18
)
dm.validate_with_fixes(fig)

issues = dm.check_figure_quality(fig)
issues = [i for i in issues if "No data" not in i and "Missing" not in i]
if issues:
    print(f"[small_multiples-advanced] quality issues: {issues}")

dm.save_formats(fig, "small_multiples_advanced")
Total running time of the script: (0 minutes 1.046 seconds)