Note
Go to the end to download the full example code.
Font Family Comparison
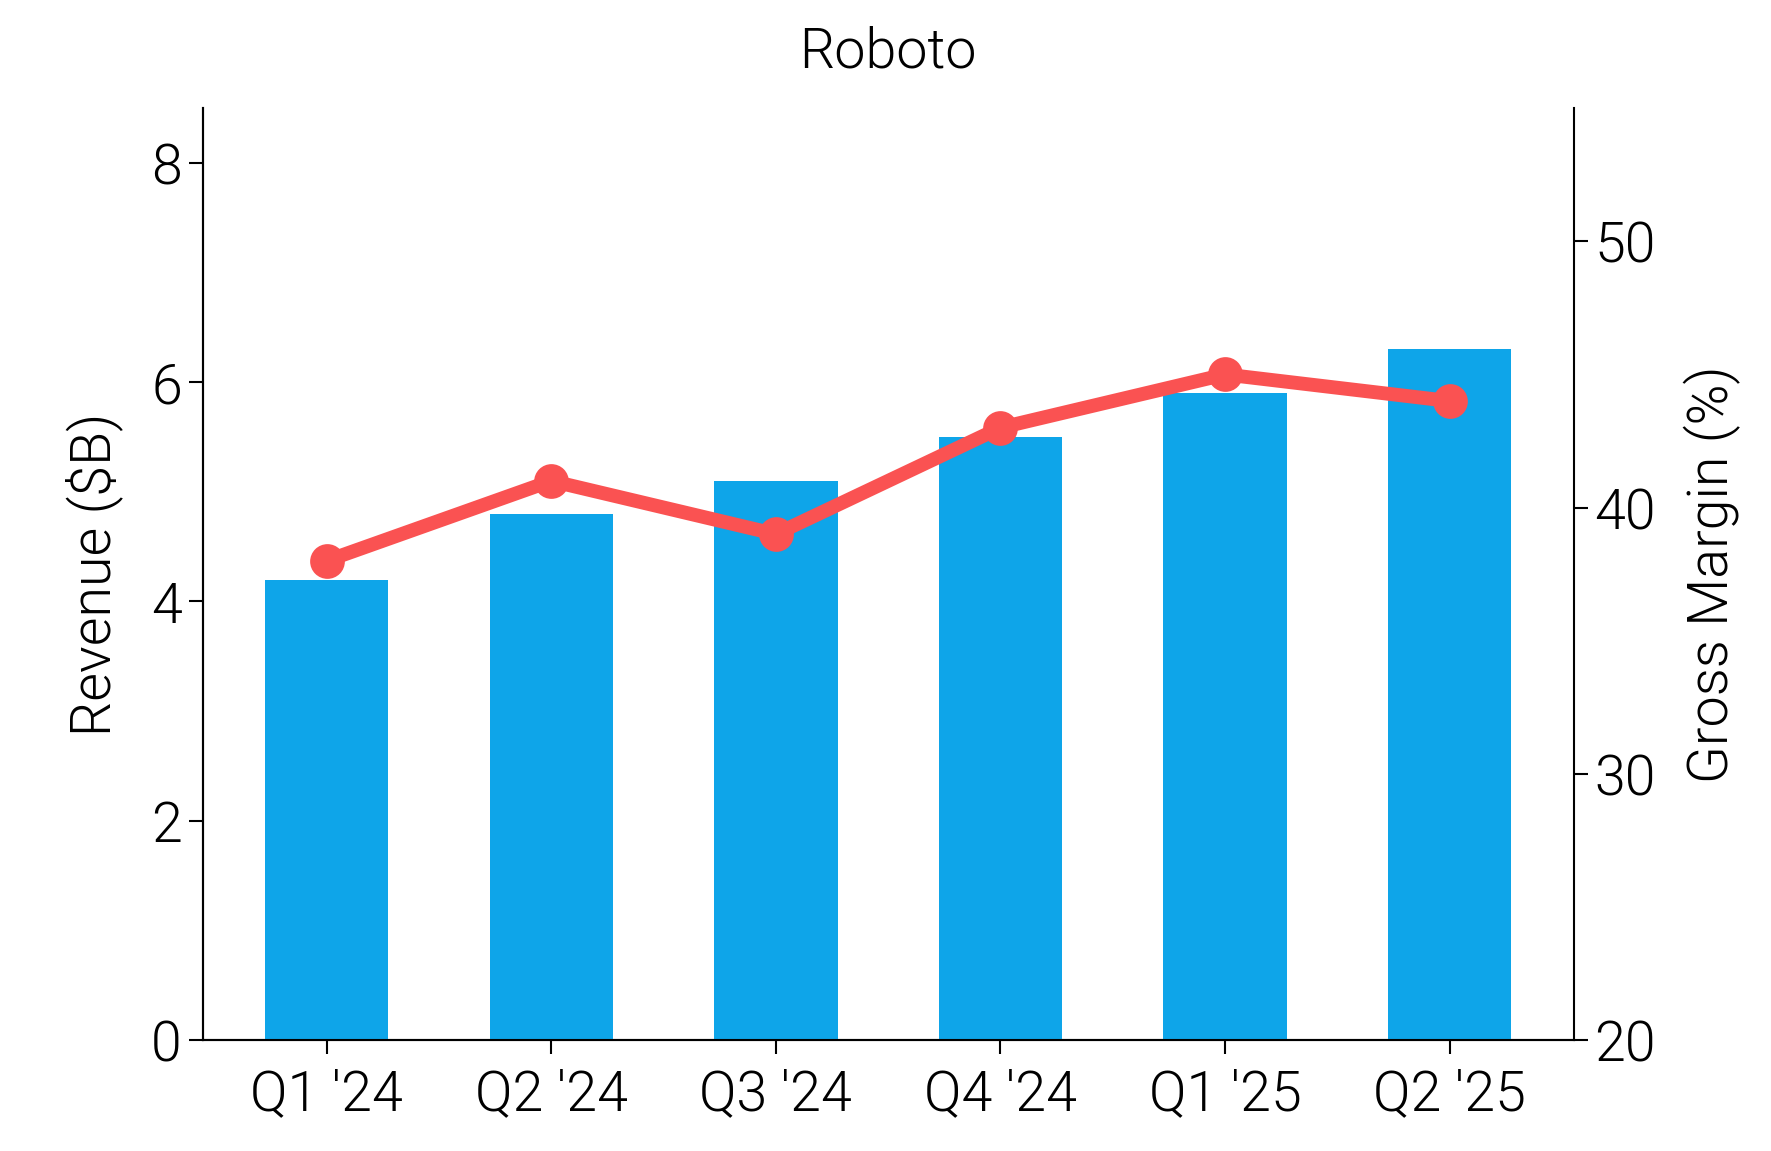
dartwork-mpl bundles 9 professional font families. This example renders the same chart six times with different typefaces so you can see at a glance how typography shapes the personality of a figure.
Every text element uses FontProperties(fname=...) to guarantee the
correct bundled font file is resolved regardless of system font cache state.
The sample data is a synthetic measurement series — the chart content is incidental; the point is to compare the visual weight of each typeface.
import os

import matplotlib.font_manager as fm
import matplotlib.pyplot as plt
import numpy as np

import dartwork_mpl as dm

dm.style.use("report")

# Generic synthetic data (no domain assumptions).
periods = ["T1", "T2", "T3", "T4", "T5", "T6"]
primary = [4.2, 4.8, 5.1, 5.5, 5.9, 6.3]
secondary = [38, 41, 39, 43, 45, 44]

# Resolve absolute path to bundled font directory.
_FONT_DIR = os.path.join(os.path.dirname(dm.__file__), "asset", "font")

# (display name, font filename for weight-300 / Light variant)
fonts = [
    ("Roboto", "Roboto-Light.ttf"),
    ("Inter", "Inter-Light.ttf"),
    ("Noto Sans", "NotoSans-Light.ttf"),
    ("Noto Sans Condensed", "NotoSans_Condensed-Light.ttf"),
    ("Paperlogy", "Paperlogy-3Light.ttf"),
    ("Noto Sans SemiCondensed", "NotoSans_SemiCondensed-Light.ttf"),
]

# Single figure, 2x3 grid — one subplot per typeface.
fig, axes = plt.subplots(
    2,
    3,
    figsize=dm.figsize("17cm", 0.55),
    sharey=False,
    gridspec_kw={"hspace": 0.6, "wspace": 0.75},
)
x = np.arange(len(periods))

for ax, (font_name, font_file) in zip(axes.flat, fonts, strict=True):
    fp = fm.FontProperties(fname=os.path.join(_FONT_DIR, font_file))

    # Bar series on the primary axis.
    ax.bar(x, primary, width=0.55, color="tw.sky500", zorder=3)
    ax.set_ylabel("Primary (a.u.)")
    ax.set_ylim(0, 8.5)
    ax.set_yticks([0, 2, 4, 6, 8])

    # Line series on the twin axis.
    ax2 = ax.twinx()
    ax2.plot(
        x,
        secondary,
        color="dc.vivid3",
        marker="o",
        markersize=4,
        lw=dm.lw(1),
        zorder=4,
    )
    ax2.set_ylabel("Secondary (%)")
    ax2.set_ylim(20, 55)
    ax2.set_yticks([20, 30, 40, 50])

    ax.set_xticks(x)
    ax.set_xticklabels(periods)
    ax.set_title(font_name)

    # Apply font to every text element in this subplot.
    for text in [
        ax.title,
        ax.yaxis.label,
        ax2.yaxis.label,
        *ax.get_xticklabels(),
        *ax.get_yticklabels(),
        *ax2.get_yticklabels(),
    ]:
        text.set_fontproperties(fp)

dm.simple_layout(fig)
plt.show()
Total running time of the script: (0 minutes 2.104 seconds)