Note
Go to the end to download the full example code.
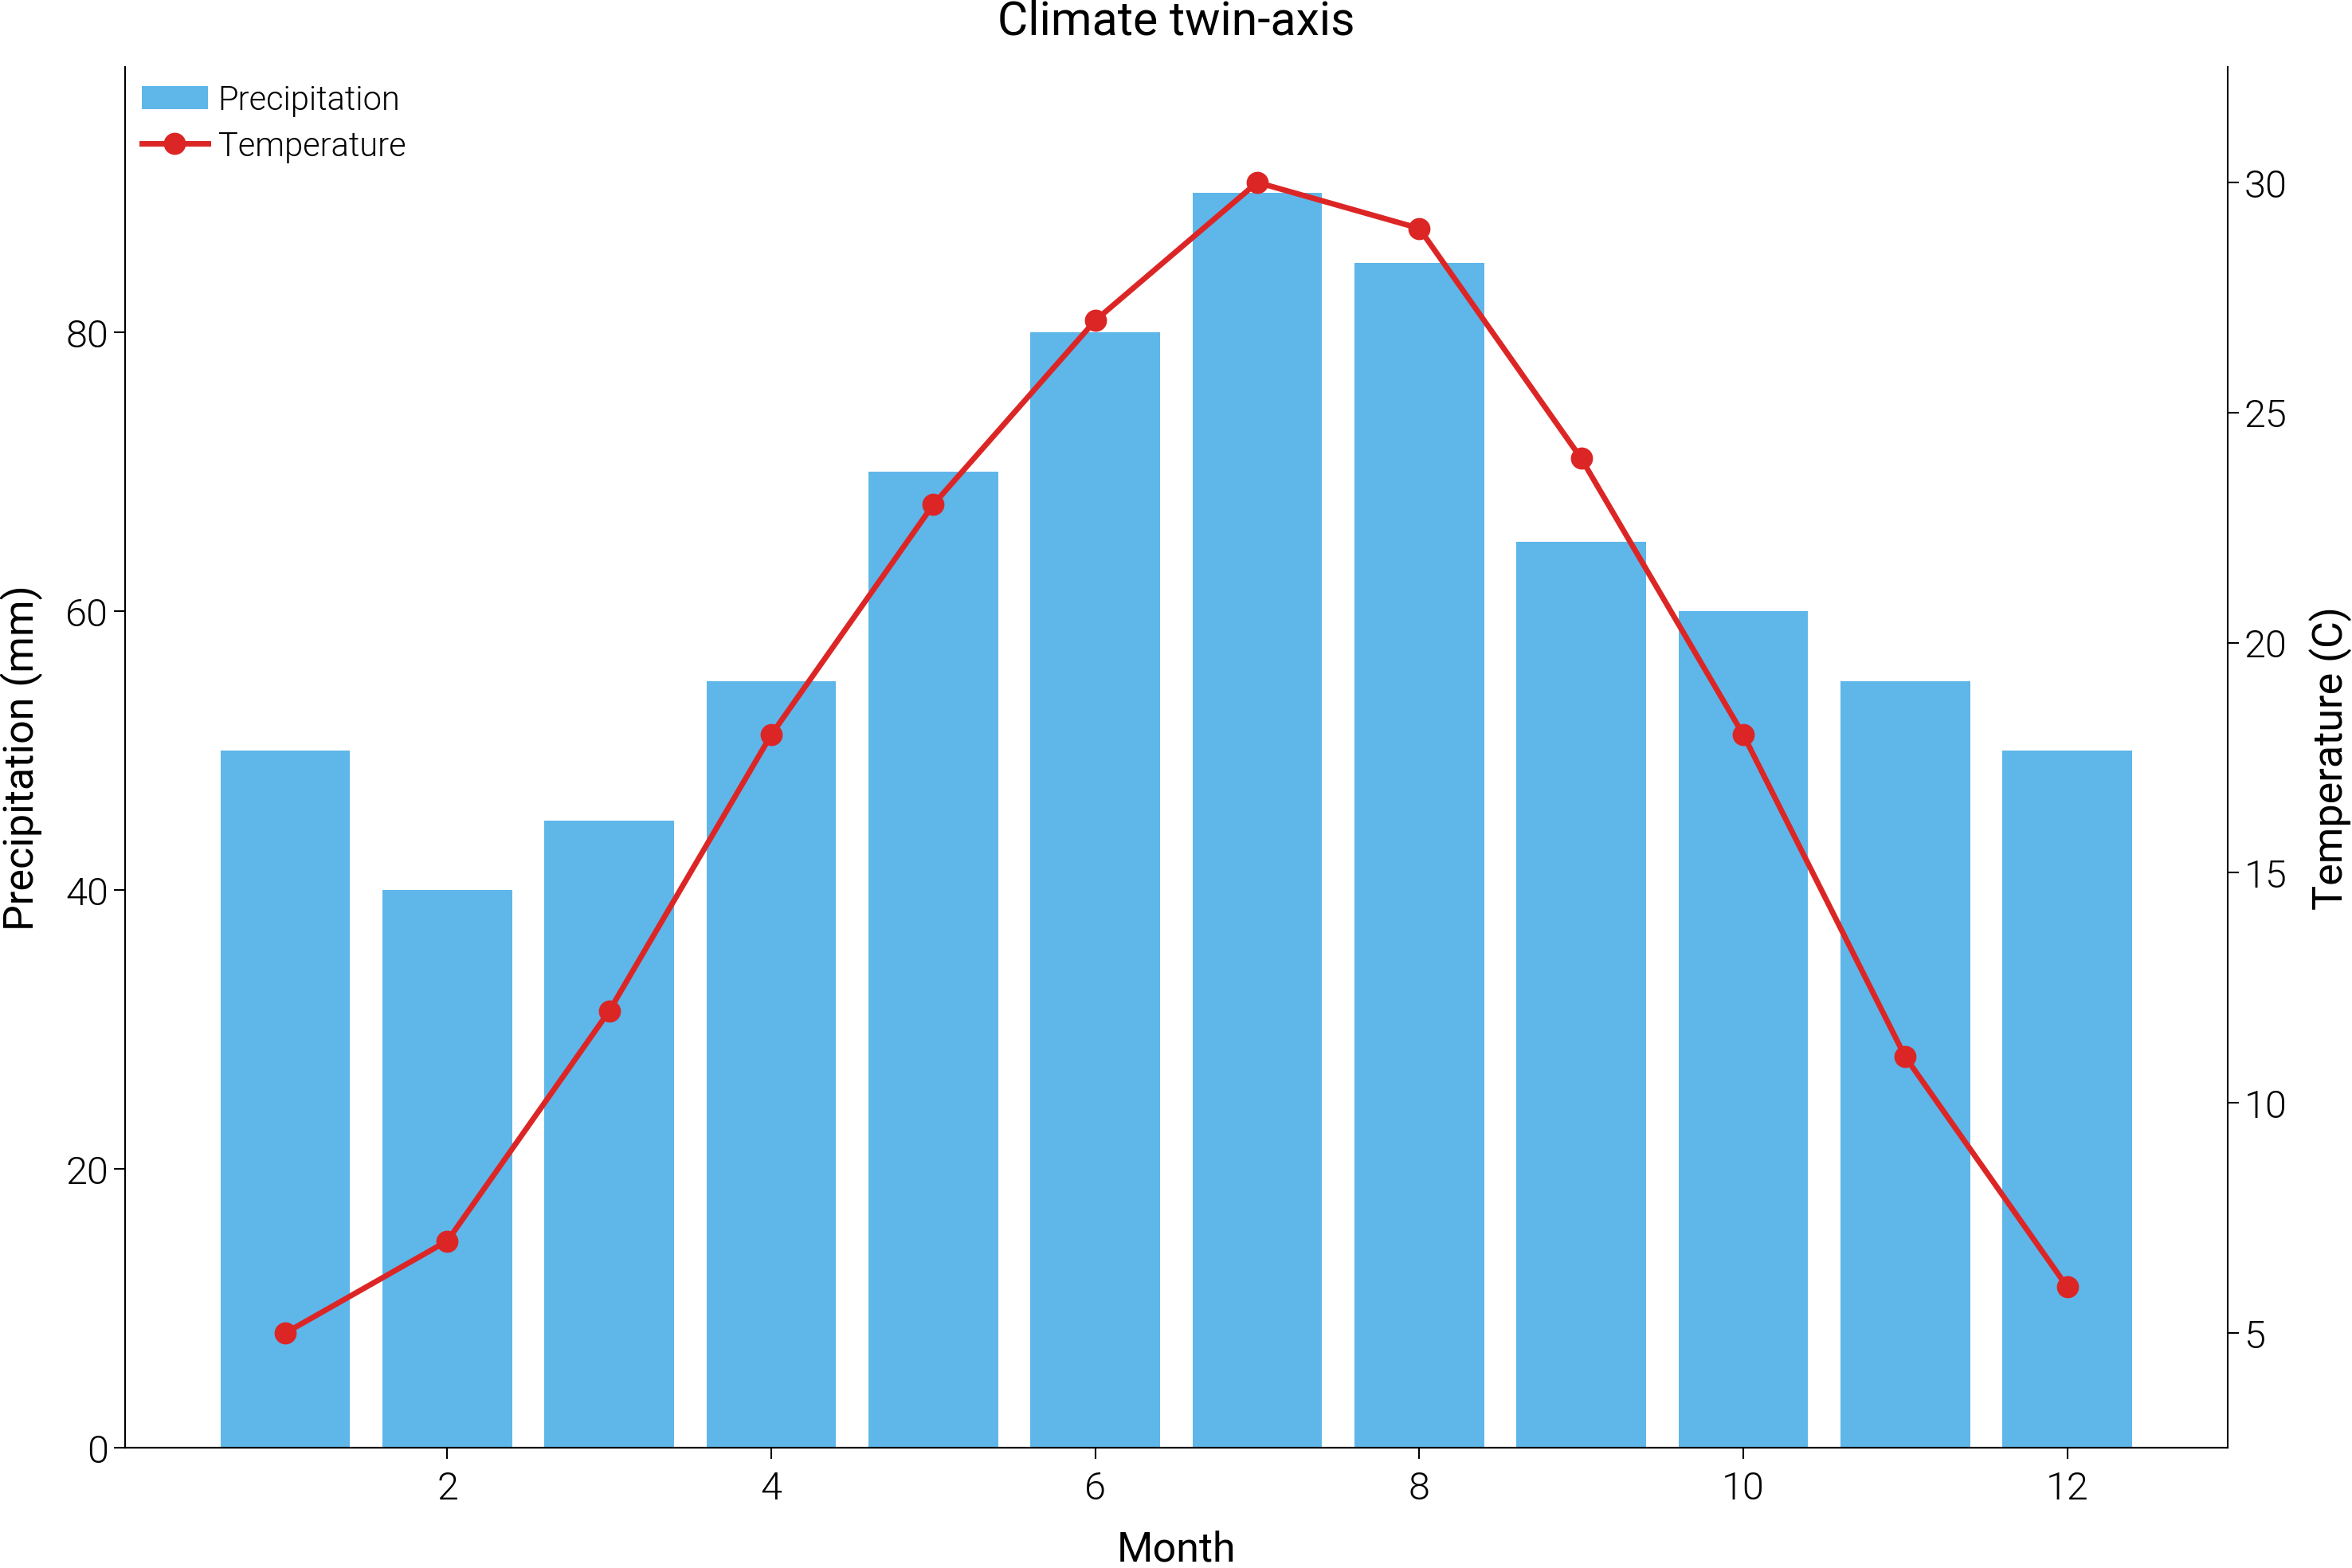
Twin axis
Twin-axis chart: bars (precip) + line (temp).
Source: dartwork_mpl/asset/prompt/05-templates/twin_axis.py ·
dm.get_prompt("05-templates/twin_axis") · MCP
dartwork-mpl://templates/twin_axis.
# ai-template-meta-start
# use_case: Show two series with different units on a shared x
# difficulty: intermediate
# data_shape: x: list[float], y_left: list[float], y_right: list[float]
# tags: dual-axis, twin-axis, twinx, multi-unit
# ai-template-meta-end

import matplotlib.pyplot as plt
import numpy as np

import dartwork_mpl as dm

dm.style.use("scientific")

x = np.arange(1, 13)
temp = [5, 7, 12, 18, 23, 27, 30, 29, 24, 18, 11, 6]
precip = [50, 40, 45, 55, 70, 80, 90, 85, 65, 60, 55, 50]

fig, ax1 = plt.subplots(figsize=dm.figsize("15cm", "wide"))
ax2 = ax1.twinx()
ax1.bar(x, precip, color="dc.teal1", alpha=0.7, label="Precipitation")
ax2.plot(
    x, temp, color="dc.orange3", marker="o", markersize=3, label="Temperature"
)
ax1.set_xlabel("Month")
ax1.set_ylabel("Precipitation (mm)")
ax2.set_ylabel("Temperature (C)")
lines1, labels1 = ax1.get_legend_handles_labels()
lines2, labels2 = ax2.get_legend_handles_labels()
ax1.legend(lines1 + lines2, labels1 + labels2, loc="upper left")
ax1.set_title("Climate twin-axis", fontsize=dm.fs(1), fontweight=dm.fw(1))

dm.simple_layout(fig)
Total running time of the script: (0 minutes 0.604 seconds)