Note
Go to the end to download the full example code.
Heatmap (Advanced)
Heatmap — advanced template (correlation matrix + in-cell labels + diverging cmap).
Source: dartwork_mpl/asset/prompt/05-templates/advanced/heatmap.py ·
MCP dartwork-mpl://template/advanced/heatmap.
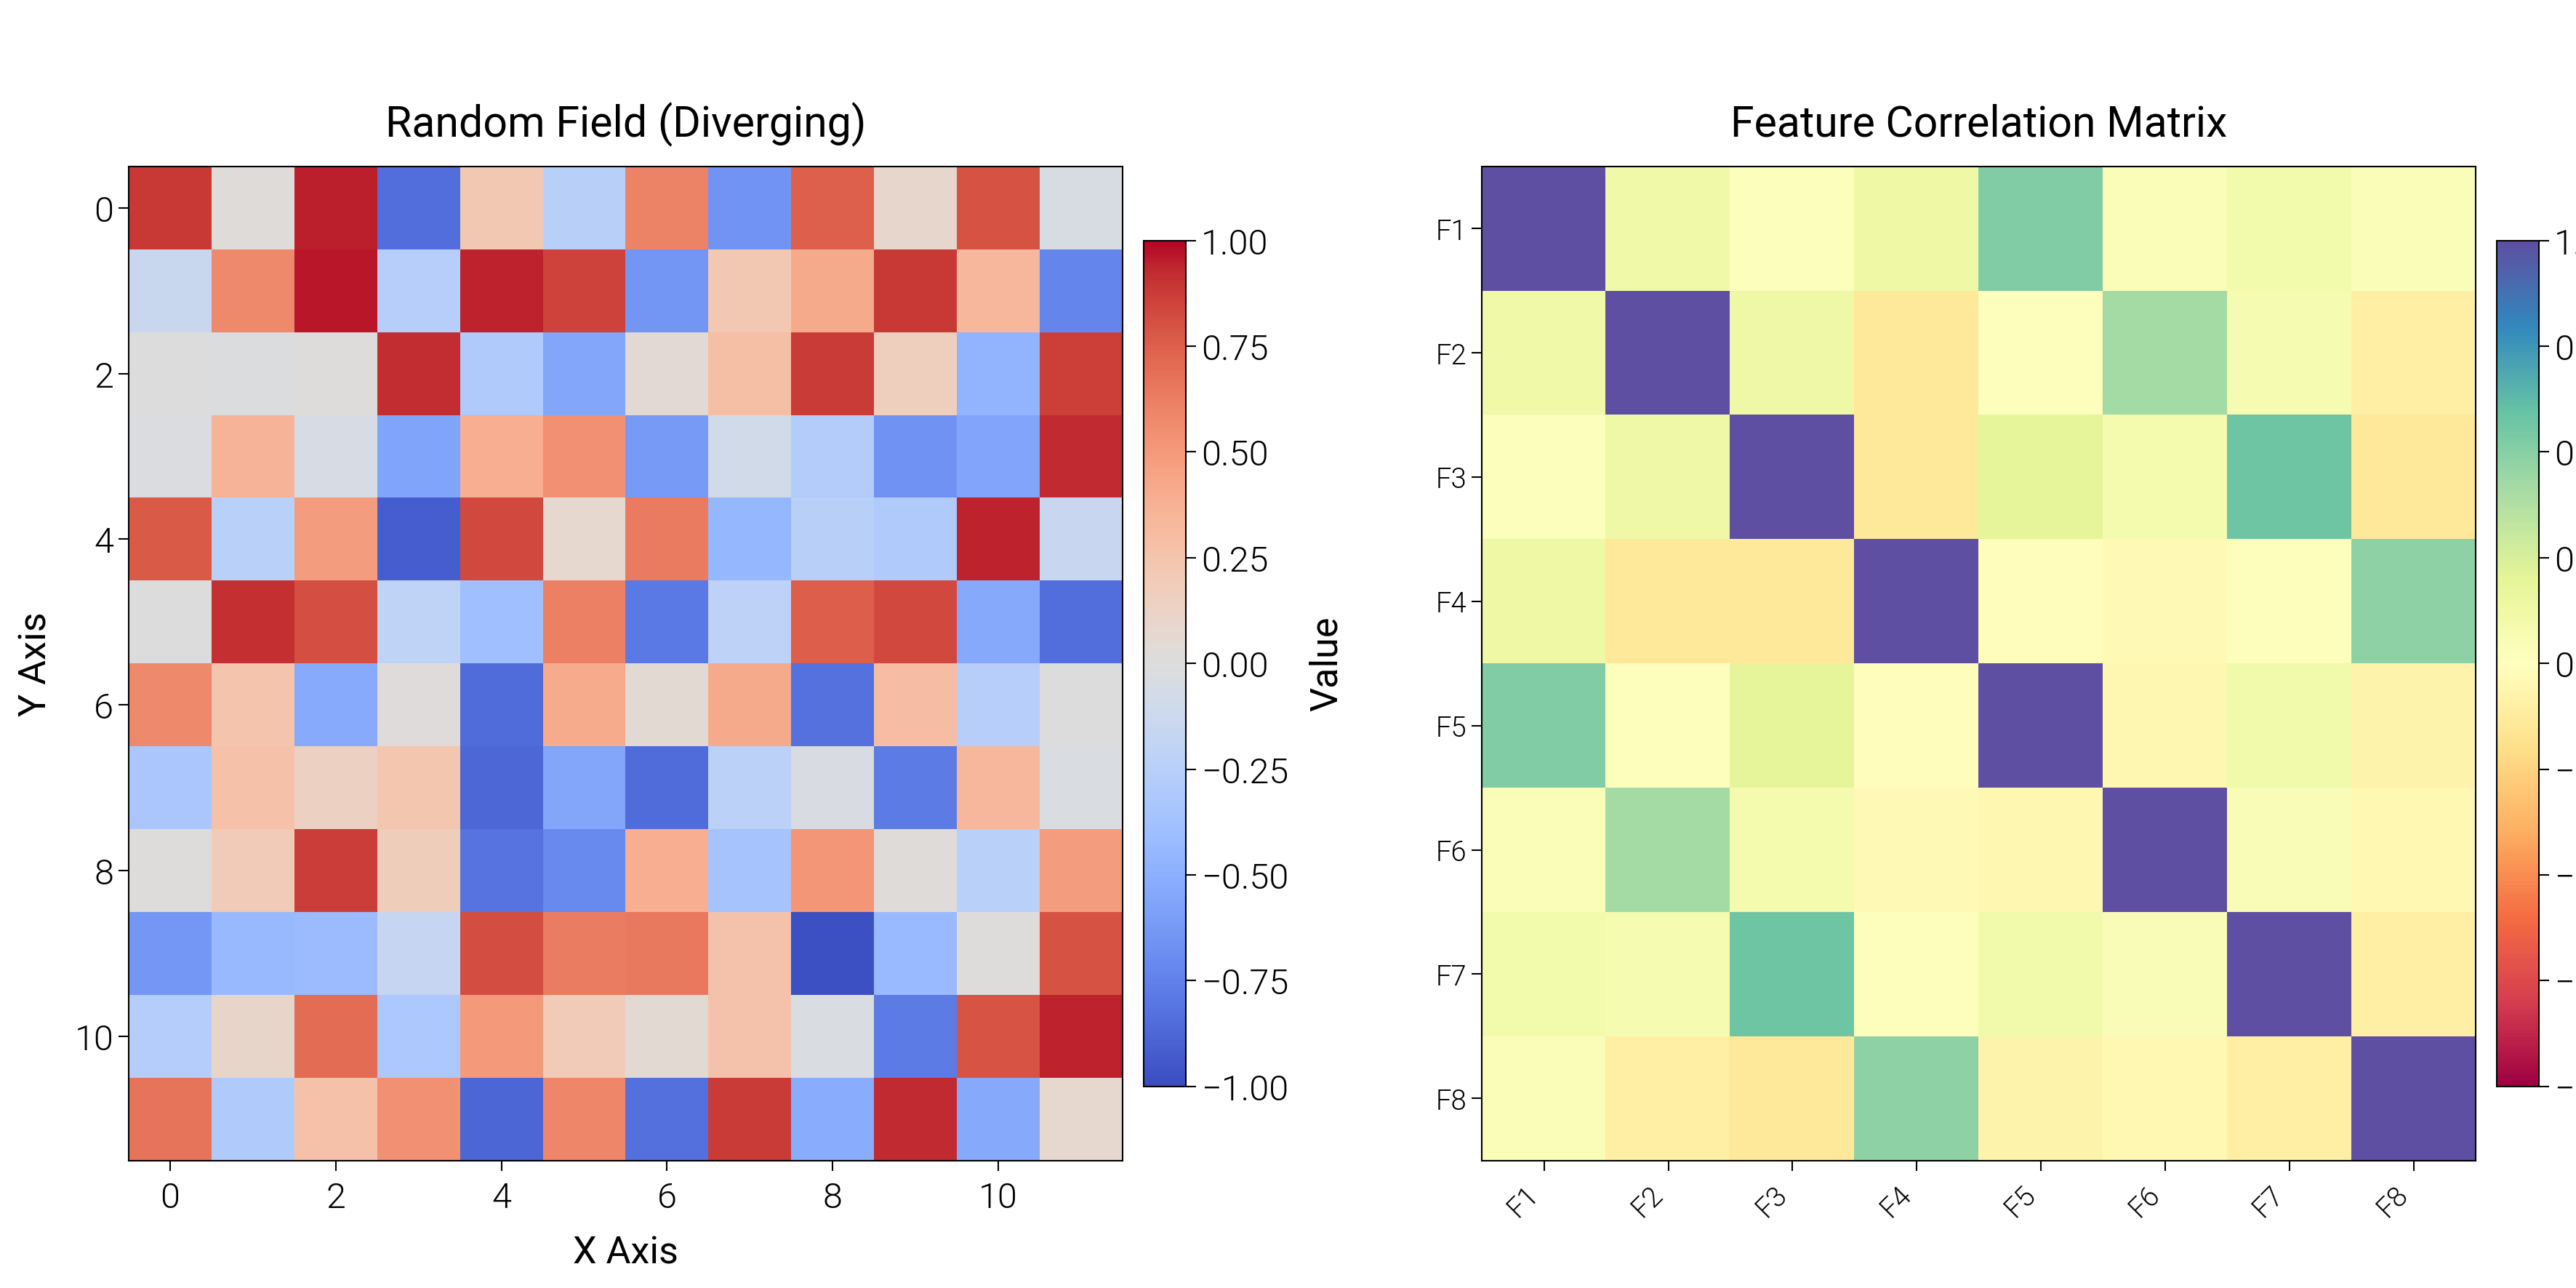
[VISUAL] 💡 TICK_ROTATION: X-axis[0]: 회전 불필요, rotation=0으로 수평 배치 가능 (max label 92.9px, slot 169.8px)
[VISUAL] ⚠️  TEXT_CONTRAST: Text contrast 1.00:1 is below the 4.5:1 AA threshold for normal text across 2 text items (sample: '+0.64')
[VISUAL] 💡 TEXT_CONTRAST: Text contrast 3.32:1 is below the 4.5:1 AA threshold for normal text (sample: 'Pairwise correlation, diagonal masked...')
[VISUAL] ⚠️  TEXT_CONTRAST: Text contrast 2.07:1 is below the 4.5:1 AA threshold for normal text (sample: 'Source: synthetic 6-asset correlation...')
[VISUAL] 💡 GRAYSCALE_SAFETY: The project modeled-relative-Y proximity heuristic before compositing found source-RGB pairs below its ΔY threshold; inspect ΔEOK separation: #053061/#063264, #053061/#073467, #053061/#08366a, #053061/#09386d, #053061/#0a3b70, #053061/#0c3d73 (+7219 more)

=== FIX SUGGESTIONS ===

TICK_ROTATION: X-axis[0]: 회전 불필요, rotation=0으로 수평 배치 가능 (max label 92.9px, slot 169.8px)
  Option 1:
    # Adjust x tick label rotation
    dm.rotate_tick_labels(ax, axis='x', rotation=0)
  Option 2:
    # Or reduce tick density
    ax.xaxis.set_major_locator(plt.MaxNLocator(nbins=6))
[VISUAL] 💡 TICK_ROTATION: X-axis[0]: 회전 불필요, rotation=0으로 수평 배치 가능 (max label 92.9px, slot 169.8px)
[VISUAL] ⚠️  TEXT_CONTRAST: Text contrast 1.00:1 is below the 4.5:1 AA threshold for normal text across 2 text items (sample: '+0.64')
[VISUAL] 💡 TEXT_CONTRAST: Text contrast 3.32:1 is below the 4.5:1 AA threshold for normal text (sample: 'Pairwise correlation, diagonal masked...')
[VISUAL] ⚠️  TEXT_CONTRAST: Text contrast 2.07:1 is below the 4.5:1 AA threshold for normal text (sample: 'Source: synthetic 6-asset correlation...')
[VISUAL] 💡 GRAYSCALE_SAFETY: The project modeled-relative-Y proximity heuristic before compositing found source-RGB pairs below its ΔY threshold; inspect ΔEOK separation: #053061/#063264, #053061/#073467, #053061/#08366a, #053061/#09386d, #053061/#0a3b70, #053061/#0c3d73 (+7219 more)
# ai-template-meta-start
# tier: advanced
# basic_counterpart: heatmap
# use_case: 6x6 asset-class correlation matrix with in-cell value labels and a diverging colormap
# difficulty: intermediate
# data_shape: matrix: 2D array (square, symmetric, values in [-1, 1])
# tags: heatmap, correlation, matrix, annotated, narrative
# narrative: Pairwise correlation of six asset classes; diagonal masked, off-diagonal labeled
# advanced_apis: imshow with RdBu_r diverging cmap (vmin=-1, vmax=1), per-cell ax.text, colorbar with formatter, masked diagonal
# ai-template-meta-end

import matplotlib.pyplot as plt
import numpy as np
from matplotlib.ticker import FuncFormatter
from mpl_toolkits.axes_grid1 import make_axes_locatable

import dartwork_mpl as dm

dm.style.use("scientific")

assets = ["Equities", "Bonds", "Gold", "REITs", "Crypto", "Cash"]
n = len(assets)

# Synthetic but plausible correlation pattern.
rng = np.random.default_rng(42)
base = np.array(
    [
        [1.00, 0.05, 0.10, 0.62, 0.35, -0.02],
        [0.05, 1.00, 0.20, -0.05, -0.10, 0.08],
        [0.10, 0.20, 1.00, 0.12, -0.08, 0.03],
        [0.62, -0.05, 0.12, 1.00, 0.30, 0.05],
        [0.35, -0.10, -0.08, 0.30, 1.00, -0.04],
        [-0.02, 0.08, 0.03, 0.05, -0.04, 1.00],
    ]
)
# Small symmetric noise so this looks like measured data, not a constant.
jitter = rng.normal(0, 0.02, size=(n, n))
jitter = (jitter + jitter.T) / 2
corr = np.clip(base + jitter, -1, 1)
np.fill_diagonal(corr, 1.0)

# Mask the diagonal so the eye locks on the off-diagonal story.
display = corr.copy()
mask = np.eye(n, dtype=bool)

fig, ax = plt.subplots(figsize=dm.figsize("13cm", "square"))

im = ax.imshow(
    np.ma.masked_array(display, mask=mask),
    cmap="RdBu_r",
    vmin=-1,
    vmax=1,
    aspect="equal",
)

# In-cell value labels — only off-diagonal.
for i in range(n):
    for j in range(n):
        if i == j:
            continue
        val = corr[i, j]
        # Pick contrasting text color: light on saturated cells, dark on pale.
        text_color = "white" if abs(val) > 0.45 else "oc.gray8"
        ax.text(
            j,
            i,
            f"{val:+.2f}",
            ha="center",
            va="center",
            fontsize=dm.fs(-1),
            color=text_color,
        )

# Tick labels.
ax.set_xticks(np.arange(n))
ax.set_yticks(np.arange(n))
ax.set_xticklabels(assets, rotation=30, ha="right", fontsize=dm.fs(-1))
ax.set_yticklabels(assets, fontsize=dm.fs(-1))
ax.tick_params(axis="both", length=0)

# Colorbar pinned to the matrix via a divider so its bar length matches
# the heatmap's spine exactly. Explicit -1, 0, +1 ticks.
divider = make_axes_locatable(ax)
cax = divider.append_axes("right", size="4%", pad=0.15)
cbar = fig.colorbar(im, cax=cax, ticks=[-1, -0.5, 0, 0.5, 1])
cbar.ax.yaxis.set_major_formatter(FuncFormatter(lambda v, _: f"{v:+.1f}"))
cbar.ax.tick_params(labelsize=dm.fs(-1))
cbar.outline.set_linewidth(0.3)

ax.set_title(
    "Equities-REITs is the only strong cross-asset link",
    fontsize=dm.fs(1),
    fontweight=dm.fw(1),
    loc="left",
    pad=18,
)
ax.text(
    0.0,
    1.02,
    "Pairwise correlation, diagonal masked — note bonds decouple from risk assets.",
    transform=ax.transAxes,
    ha="left",
    va="bottom",
    fontsize=dm.fs(-1),
    color="oc.gray6",
)

fig.text(
    0.01,
    0.005,
    "Source: synthetic 6-asset correlation panel (rng seed 42).",
    fontsize=dm.fs(-2),
    color="oc.gray5",
    ha="left",
    va="bottom",
)

dm.simple_layout(fig, margin=dm.inch(0.45))
dm.validate_with_fixes(fig)

issues = dm.check_figure_quality(fig)
# Heatmap with rotated tick labels acts as axis labels; quality checker
# flags missing set_xlabel/ylabel — that's a false positive here.
issues = [i for i in issues if "Missing" not in i and "No data" not in i]
if issues:
    print(f"[heatmap-advanced] quality issues: {issues}")

dm.save_formats(fig, "heatmap_advanced")
Total running time of the script: (0 minutes 0.946 seconds)