Advanced AI Plot Templates (Tier 2)

Tier-2 templates extend each basic plot type with:

  • Believable synthetic data (a story, not random noise)

  • Reference lines / event windows / threshold annotations

  • Per-element value labels (bars, points, segments)

  • Narrative title + takeaway subtitle

  • Source footnote

  • Self-validation via dm.validate_with_fixes + dm.check_figure_quality

Use these as the gold standard when you want the AI-generated plot to read like a finished report figure. See the basic gallery one level up for the minimal “just get a chart out” version.
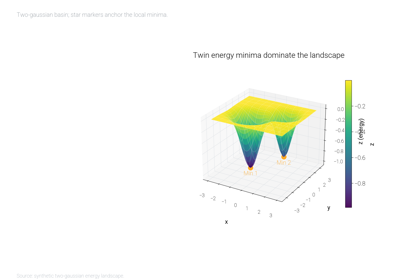
3D Surface (Advanced)

3D Surface (Advanced)

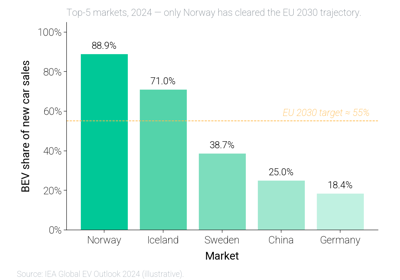
Bar (Advanced)

Bar (Advanced)

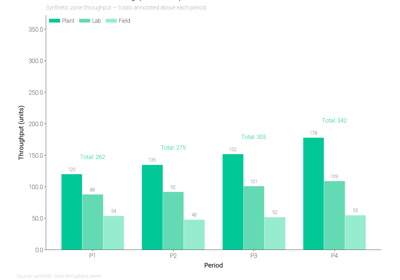
Grouped Bar (Advanced)

Grouped Bar (Advanced)

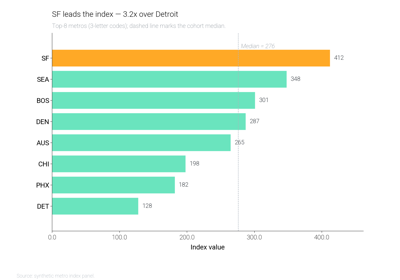
Horizontal Bar (Advanced)

Horizontal Bar (Advanced)

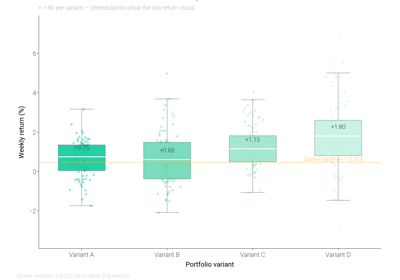
Boxplot (Advanced)

Boxplot (Advanced)

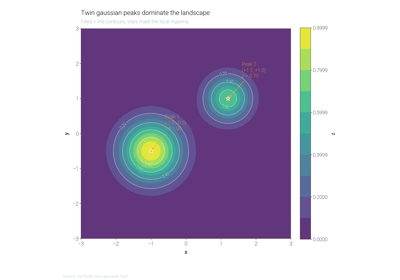
Contour (Advanced)

Contour (Advanced)

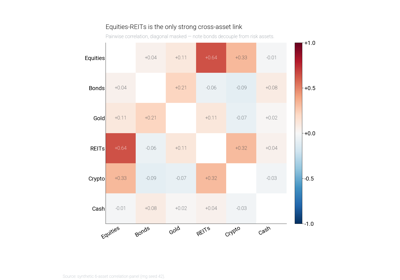
Heatmap (Advanced)

Heatmap (Advanced)

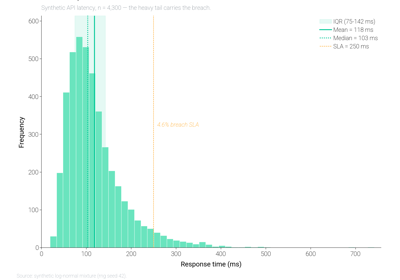
Histogram (Advanced)

Histogram (Advanced)

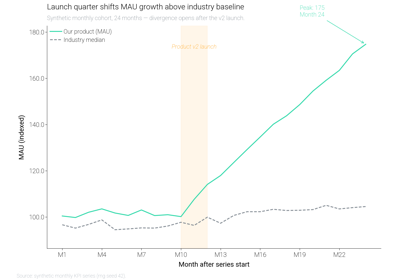
Line (Advanced)

Line (Advanced)

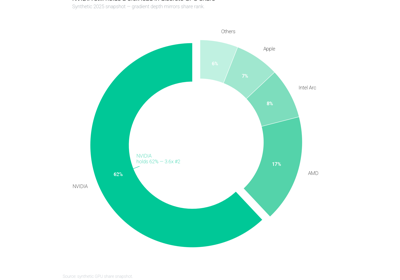
Pie (Advanced)

Pie (Advanced)

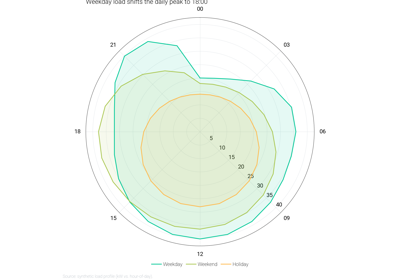
Polar (Advanced)

Polar (Advanced)

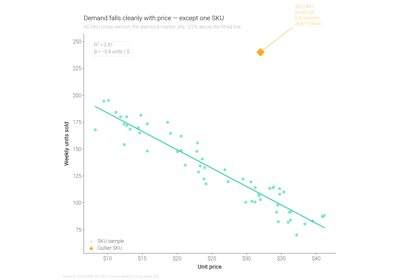
Scatter (Advanced)

Scatter (Advanced)

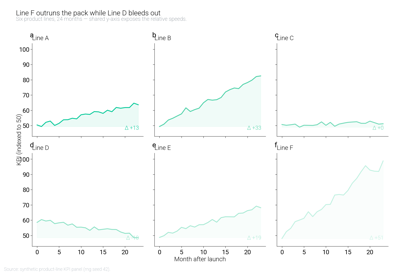
Small Multiples (Advanced)

Small Multiples (Advanced)

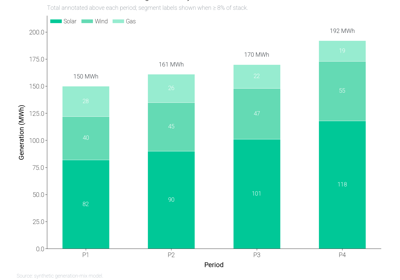
Stacked Bar (Advanced)

Stacked Bar (Advanced)

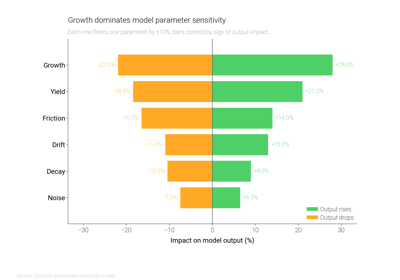
Tornado (Advanced)

Tornado (Advanced)

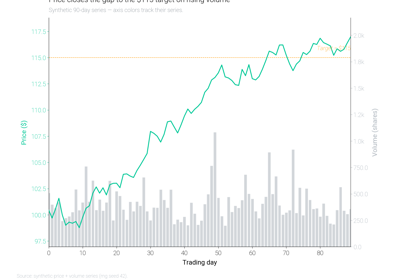
Twin Axis (Advanced)

Twin Axis (Advanced)

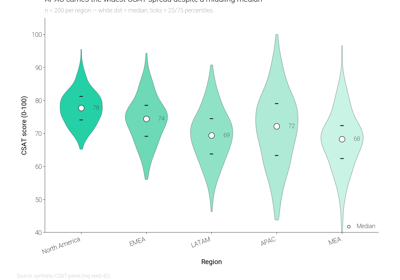
Violin (Advanced)

Violin (Advanced)

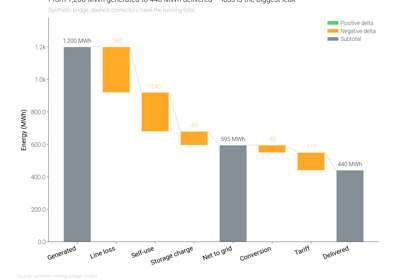
Waterfall (Advanced)

Waterfall (Advanced)