Note
Go to the end to download the full example code.
Myriad Labels with Tokens and Grid Sizing
This example combines per-panel physical sizing, semantic design tokens, and East-Asian myriad axis labels. The same cumulative observation count series is shown with Korean and Japanese 10^4 labels so large counts remain compact without changing the underlying data.
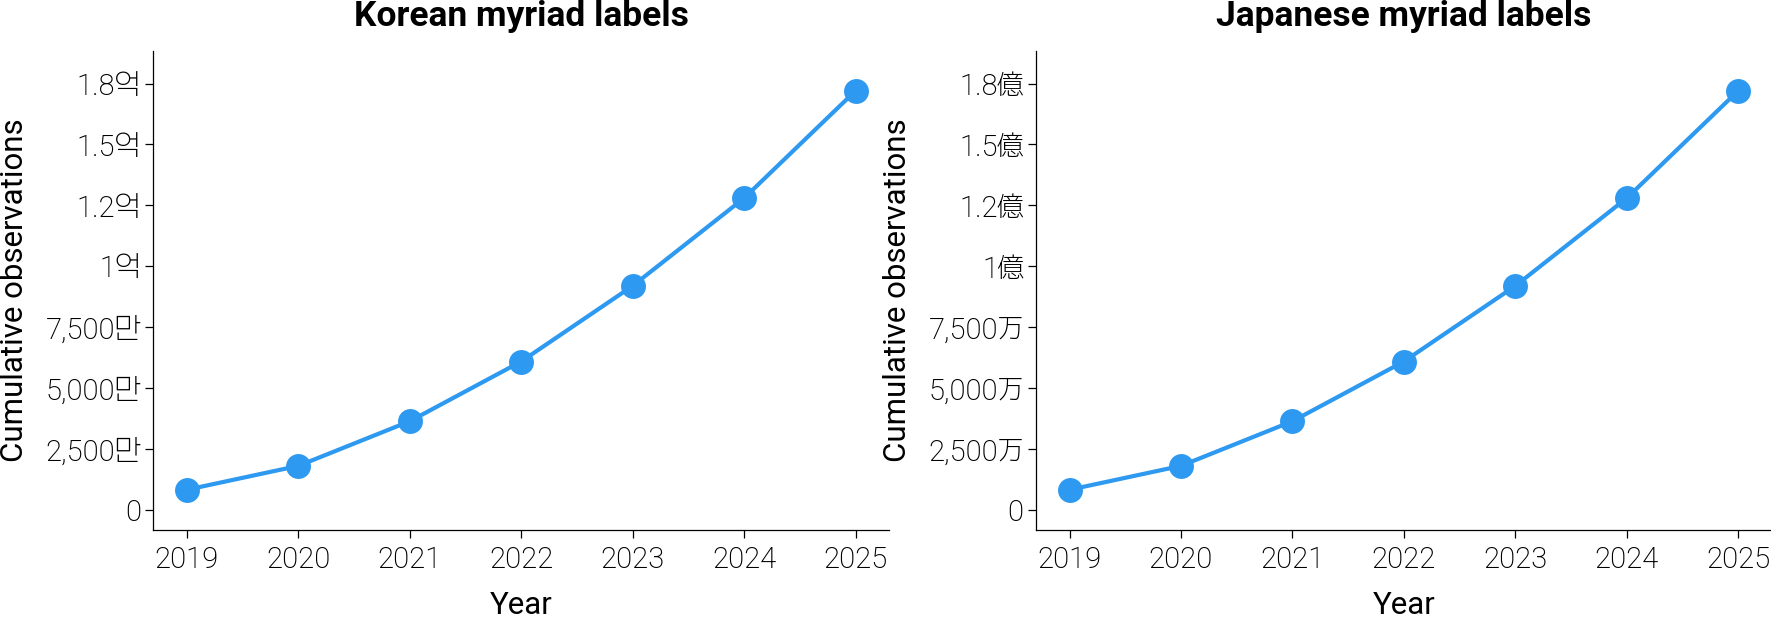
import matplotlib.pyplot as plt

import dartwork_mpl as dm

dm.style.use("scientific")

years = [2019, 2020, 2021, 2022, 2023, 2024, 2025]
observations = [
    8_400_000,
    18_200_000,
    36_500_000,
    61_000_000,
    92_000_000,
    128_000_000,
    172_000_000,
]

fig, axes = plt.subplots(
    ncols=2, figsize=dm.figsize_grid("7cm", "standard", ncols=2, gap="1cm")
)

panels = [
    (axes[0], "ko", "Korean myriad labels"),
    (axes[1], "ja", "Japanese myriad labels"),
]

for ax, locale, title in panels:
    ax.plot(years, observations, linewidth=dm.tokens.lw_trend())
    ax.scatter(years, observations, s=dm.tokens.scatter_size())
    ax.set_title(title, fontsize=dm.tokens.fs_title())
    ax.set_xlabel("Year")
    ax.set_ylabel("Cumulative observations")
    dm.format_axis_myriad(ax, axis="y", locale=locale)

dm.simple_layout(fig)
Total running time of the script: (0 minutes 0.322 seconds)