Note
Go to the end to download the full example code.
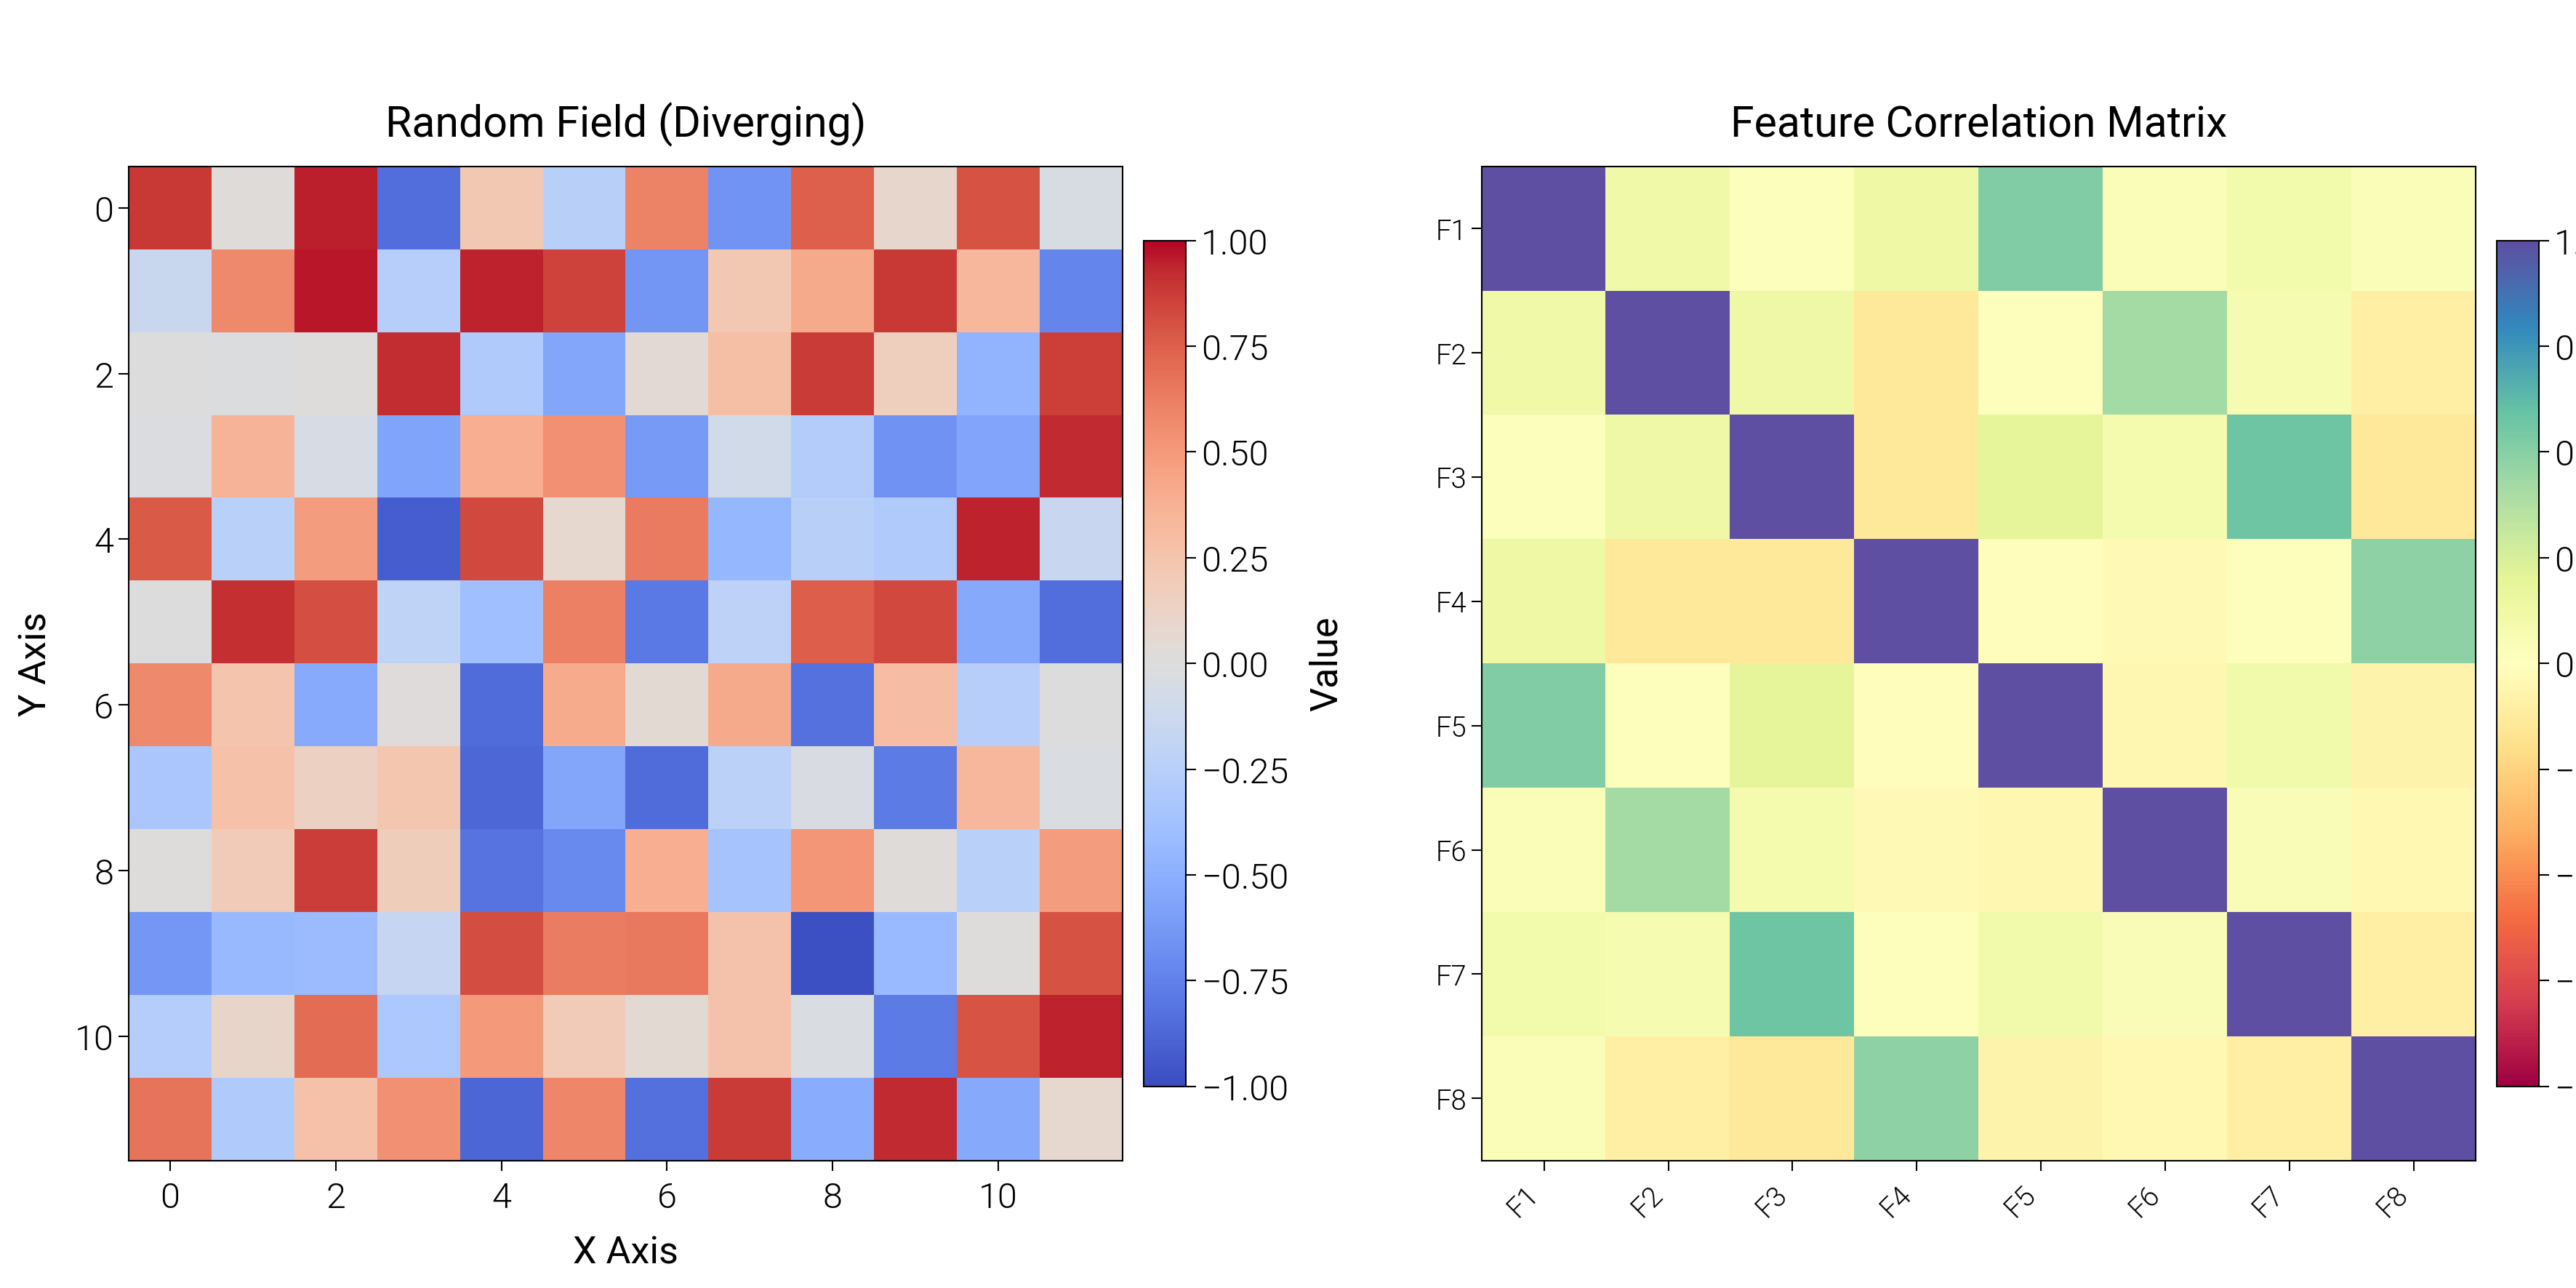
Heatmap
8x8 random heatmap with colorbar.
Source: dartwork_mpl/asset/prompt/05-templates/heatmap.py ·
dm.get_prompt("05-templates/heatmap") · MCP
dartwork-mpl://templates/heatmap.
# ai-template-meta-start
# use_case: Show a 2D matrix with color-coded magnitude
# difficulty: beginner
# data_shape: matrix: 2D array
# tags: heatmap, matrix, correlation, image
# ai-template-meta-end

import matplotlib.pyplot as plt
import numpy as np
from mpl_toolkits.axes_grid1 import make_axes_locatable

import dartwork_mpl as dm

dm.style.use("scientific")

rng = np.random.default_rng(42)
data = rng.random(size=(8, 8))

fig, ax = plt.subplots(figsize=dm.figsize("11cm", "square"))
im = ax.imshow(data, cmap="viridis", aspect="equal")
# Colorbar pinned to the heatmap so its bar length matches the spine.
cax = make_axes_locatable(ax).append_axes("right", size="4%", pad=0.15)
fig.colorbar(im, cax=cax)
ax.set_xlabel("Column")
ax.set_ylabel("Row")
ax.set_title("Heatmap", fontsize=dm.fs(1), fontweight=dm.fw(1))

dm.simple_layout(fig)
Total running time of the script: (0 minutes 0.579 seconds)