Note
Go to the end to download the full example code.
Grouped Bar (Advanced)
Grouped bar — advanced template (per-bar labels + per-category totals).
Source: dartwork_mpl/asset/prompt/05-templates/advanced/bar_grouped.py ·
MCP dartwork-mpl://template/advanced/bar_grouped.
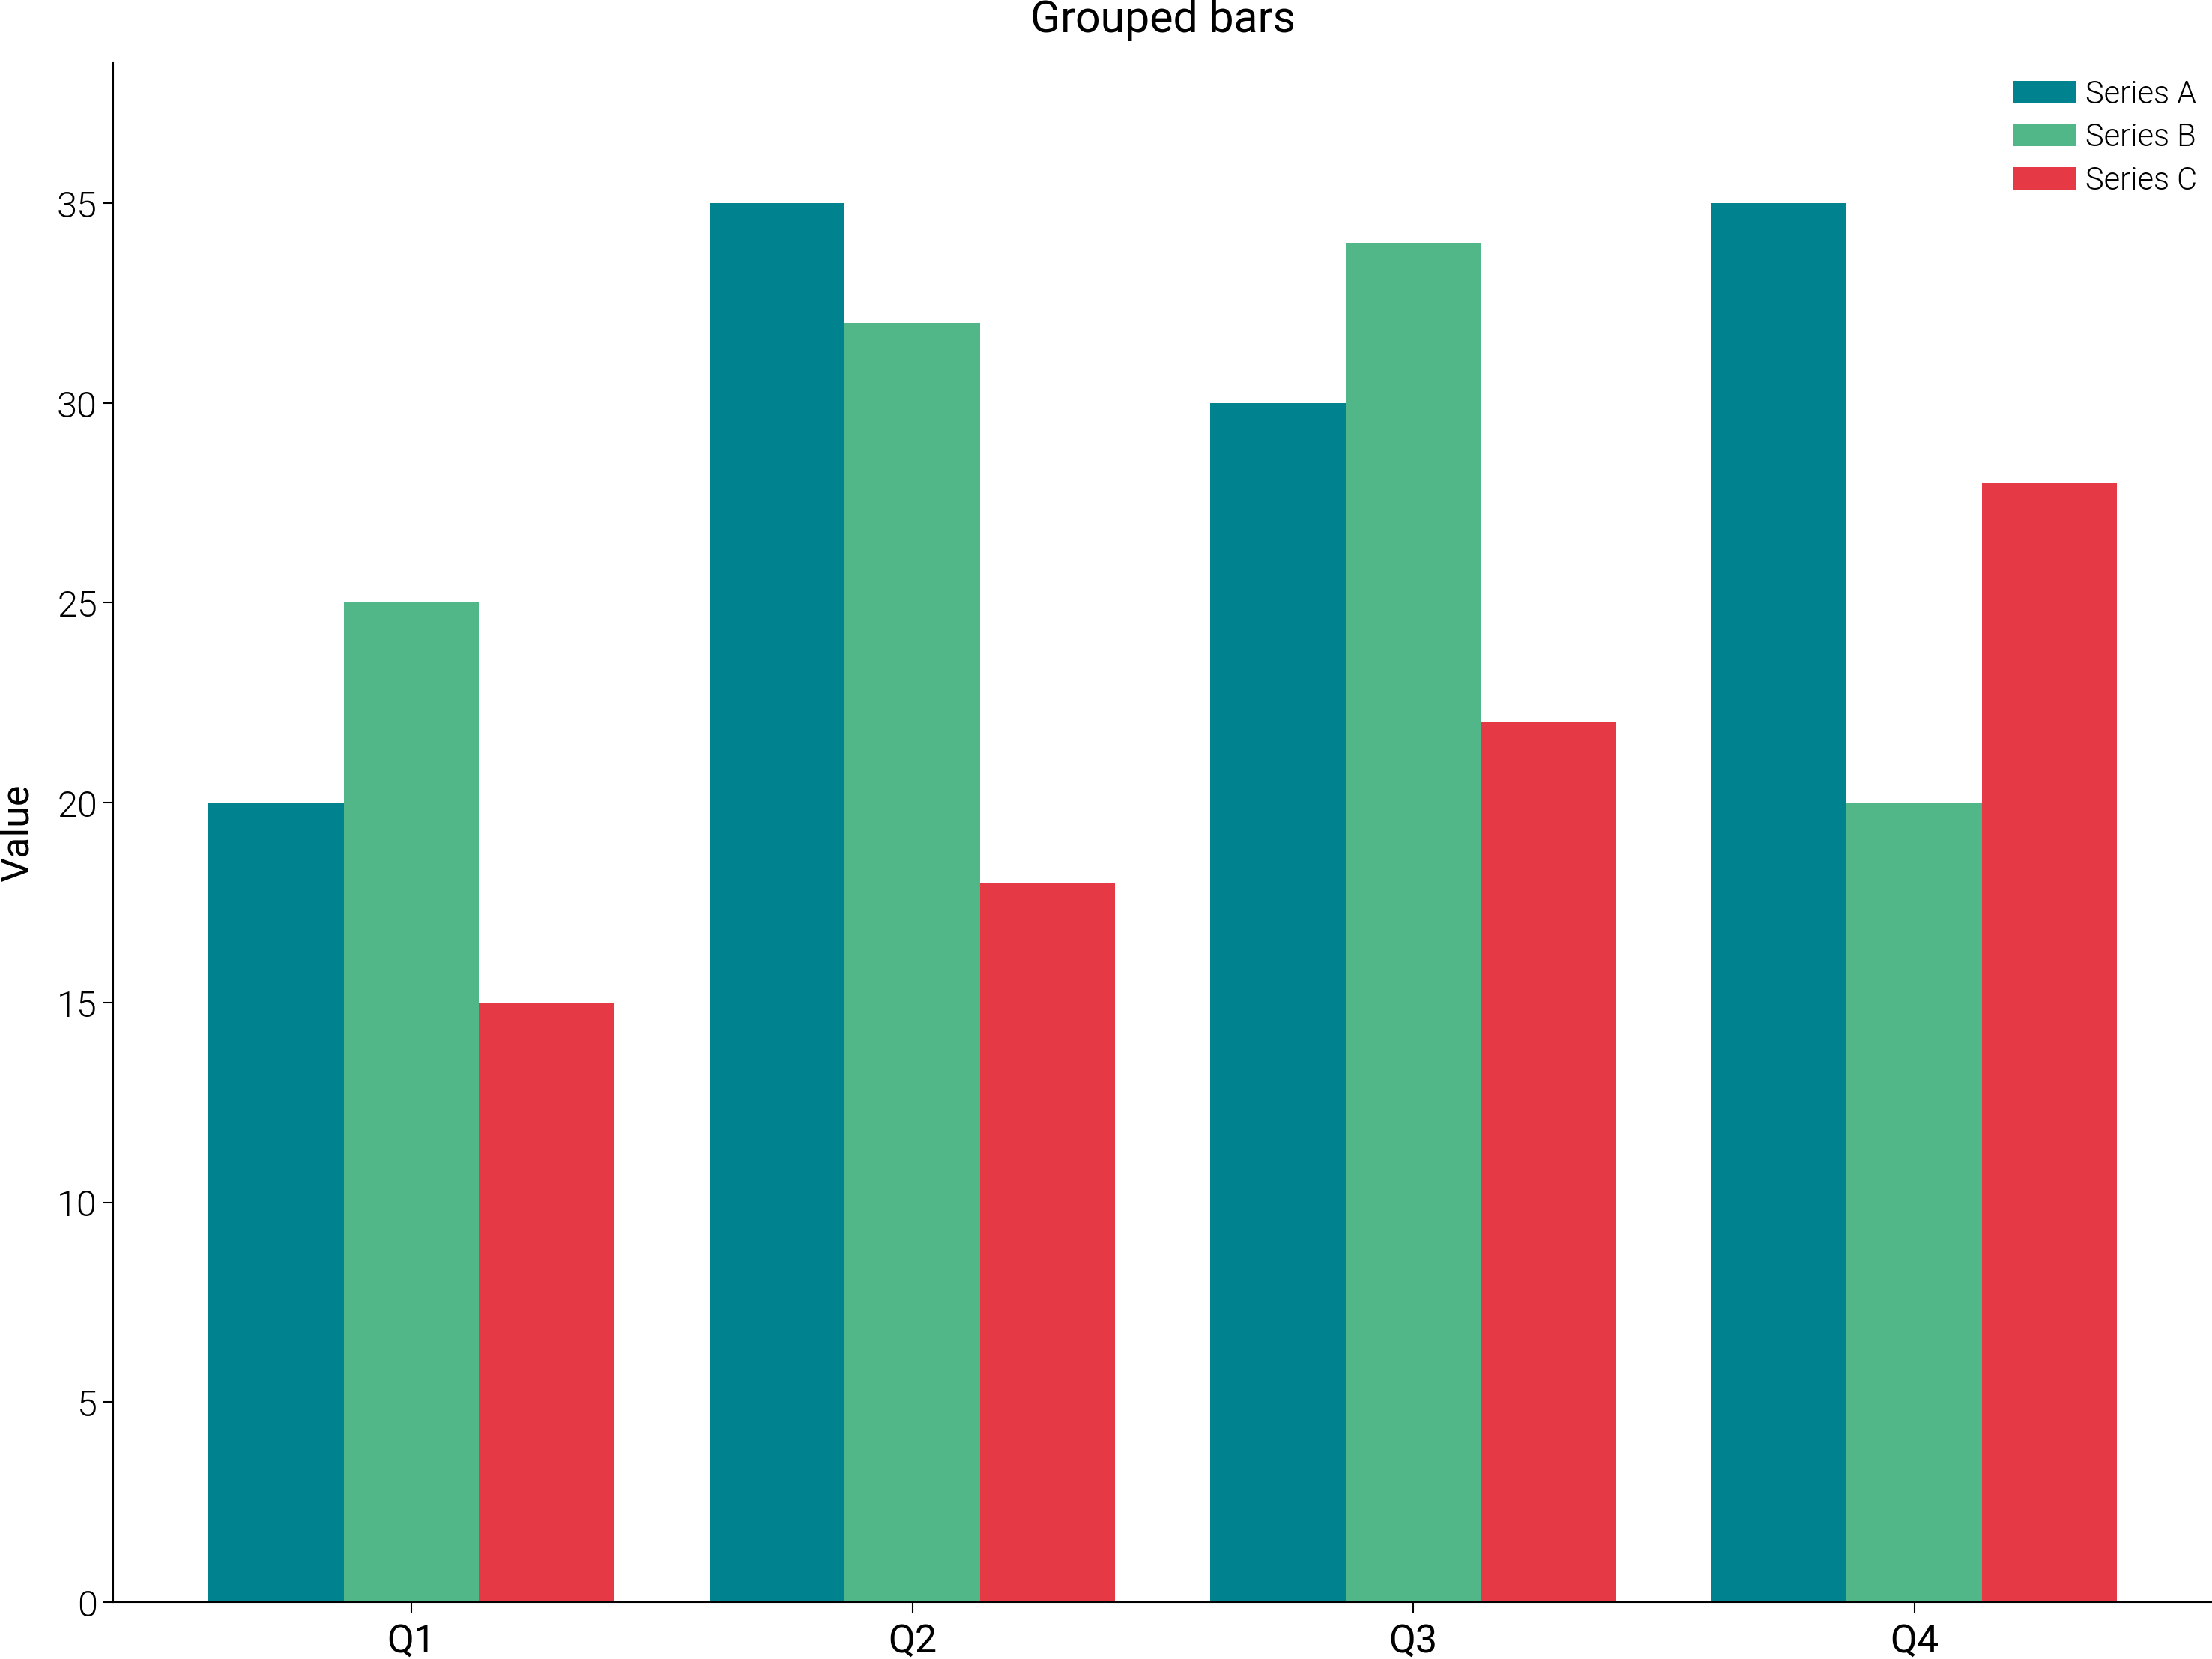
[VISUAL] 💡 TICK_DECIMAL: Y-axis[0]: trailing zero in integer tick labels (example '50.0')
[VISUAL] ⚠️  TEXT_CONTRAST: Text contrast 2.16:1 is below the 4.5:1 AA threshold for normal text across 4 text items (sample: 'Total: 262')
[VISUAL] 💡 TEXT_CONTRAST: Text contrast 3.32:1 is below the 4.5:1 AA threshold for normal text (sample: 'Synthetic zone throughput — totals an...')
[VISUAL] ⚠️  TEXT_CONTRAST: Text contrast 2.07:1 is below the 4.5:1 AA threshold for normal text (sample: 'Source: synthetic zone throughput panel.')

=== FIX SUGGESTIONS ===

TICK_DECIMAL: Y-axis[0]: trailing zero in integer tick labels (example '50.0')
  Option 1:
    # Match tick precision to the tick step
    ax.yaxis.set_major_formatter(mticker.StrMethodFormatter('{x:.0f}'))
  Option 2:
    # Or let matplotlib choose compact numeric labels
    ax.yaxis.set_major_formatter(mticker.ScalarFormatter())
[VISUAL] 💡 TICK_DECIMAL: Y-axis[0]: trailing zero in integer tick labels (example '50.0')
[VISUAL] ⚠️  TEXT_CONTRAST: Text contrast 2.16:1 is below the 4.5:1 AA threshold for normal text across 4 text items (sample: 'Total: 262')
[VISUAL] 💡 TEXT_CONTRAST: Text contrast 3.32:1 is below the 4.5:1 AA threshold for normal text (sample: 'Synthetic zone throughput — totals an...')
[VISUAL] ⚠️  TEXT_CONTRAST: Text contrast 2.07:1 is below the 4.5:1 AA threshold for normal text (sample: 'Source: synthetic zone throughput panel.')
# ai-template-meta-start
# tier: advanced
# basic_counterpart: bar_grouped
# use_case: Multi-series quarterly comparison with per-bar value labels and per-category totals
# difficulty: intermediate
# data_shape: categories: list[str], series: dict[str, list[float]]
# tags: bar, grouped, multi-series, annotated, narrative
# narrative: Throughput by zone across four periods (Plant / Lab / Field) — totals annotated
# advanced_apis: per-bar value labels, total annotation above each group, format_axis_si, legend frameon=False
# ai-template-meta-end

import matplotlib.pyplot as plt
import numpy as np

import dartwork_mpl as dm

dm.style.use("scientific")

categories = ["P1", "P2", "P3", "P4"]
series = {
    "Plant": [120, 135, 152, 178],
    "Lab": [88, 92, 101, 109],
    "Field": [54, 48, 52, 55],
}
series_names = list(series.keys())
gradient = dm.cspace("dc.teal5", "dc.teal2", n=len(series_names))
colors = [c.to_hex() for c in gradient]

x = np.arange(len(categories))
bar_width = 0.26

fig, ax = plt.subplots(figsize=dm.figsize("15cm", "standard"))

for i, name in enumerate(series_names):
    offset = (i - 1) * bar_width
    vals = series[name]
    bars = ax.bar(
        x + offset,
        vals,
        bar_width,
        label=name,
        color=colors[i],
        edgecolor="white",
        linewidth=0.3,
    )
    for b, v in zip(bars, vals, strict=False):
        ax.text(
            b.get_x() + b.get_width() / 2,
            v + 3,
            f"{v}",
            ha="center",
            va="bottom",
            fontsize=dm.fs(-2),
            color="oc.gray8",
        )

# Per-category total above the cluster.
totals = [
    sum(series[n][q] for n in series_names) for q in range(len(categories))
]
for q, total in enumerate(totals):
    ax.text(
        x[q],
        max(series[n][q] for n in series_names) + 22,
        f"Total: {total}",
        ha="center",
        va="bottom",
        fontsize=dm.fs(-1),
        fontweight=dm.fw(1),
        color="dc.teal5",
    )

ax.set_xticks(x)
ax.set_xticklabels(categories)
ax.set_ylabel("Throughput (units)")
ax.set_xlabel("Period")
ax.set_ylim(0, max(totals) * 1.0 + 30)
dm.format_axis_si(ax, axis="y")

ax.legend(loc="upper left", fontsize=dm.fs(-1), frameon=False, ncol=3)

ax.set_title(
    "Plant zone drives P4 throughput as Field plateaus",
    fontsize=dm.fs(1),
    fontweight=dm.fw(1),
    loc="left",
    pad=18,
)
ax.text(
    0.0,
    1.02,
    "Synthetic zone throughput — totals annotated above each period.",
    transform=ax.transAxes,
    ha="left",
    va="bottom",
    fontsize=dm.fs(-1),
    color="oc.gray6",
)

fig.text(
    0.01,
    0.005,
    "Source: synthetic zone throughput panel.",
    fontsize=dm.fs(-2),
    color="oc.gray5",
    ha="left",
    va="bottom",
)

dm.simple_layout(fig, margin=dm.inch(0.08))
dm.validate_with_fixes(fig)

issues = dm.check_figure_quality(fig)
issues = [i for i in issues if "No data" not in i]
if issues:
    print(f"[bar_grouped-advanced] quality issues: {issues}")

dm.save_formats(fig, "bar_grouped_advanced")
Total running time of the script: (0 minutes 0.662 seconds)