Note
Go to the end to download the full example code.
Boxplot
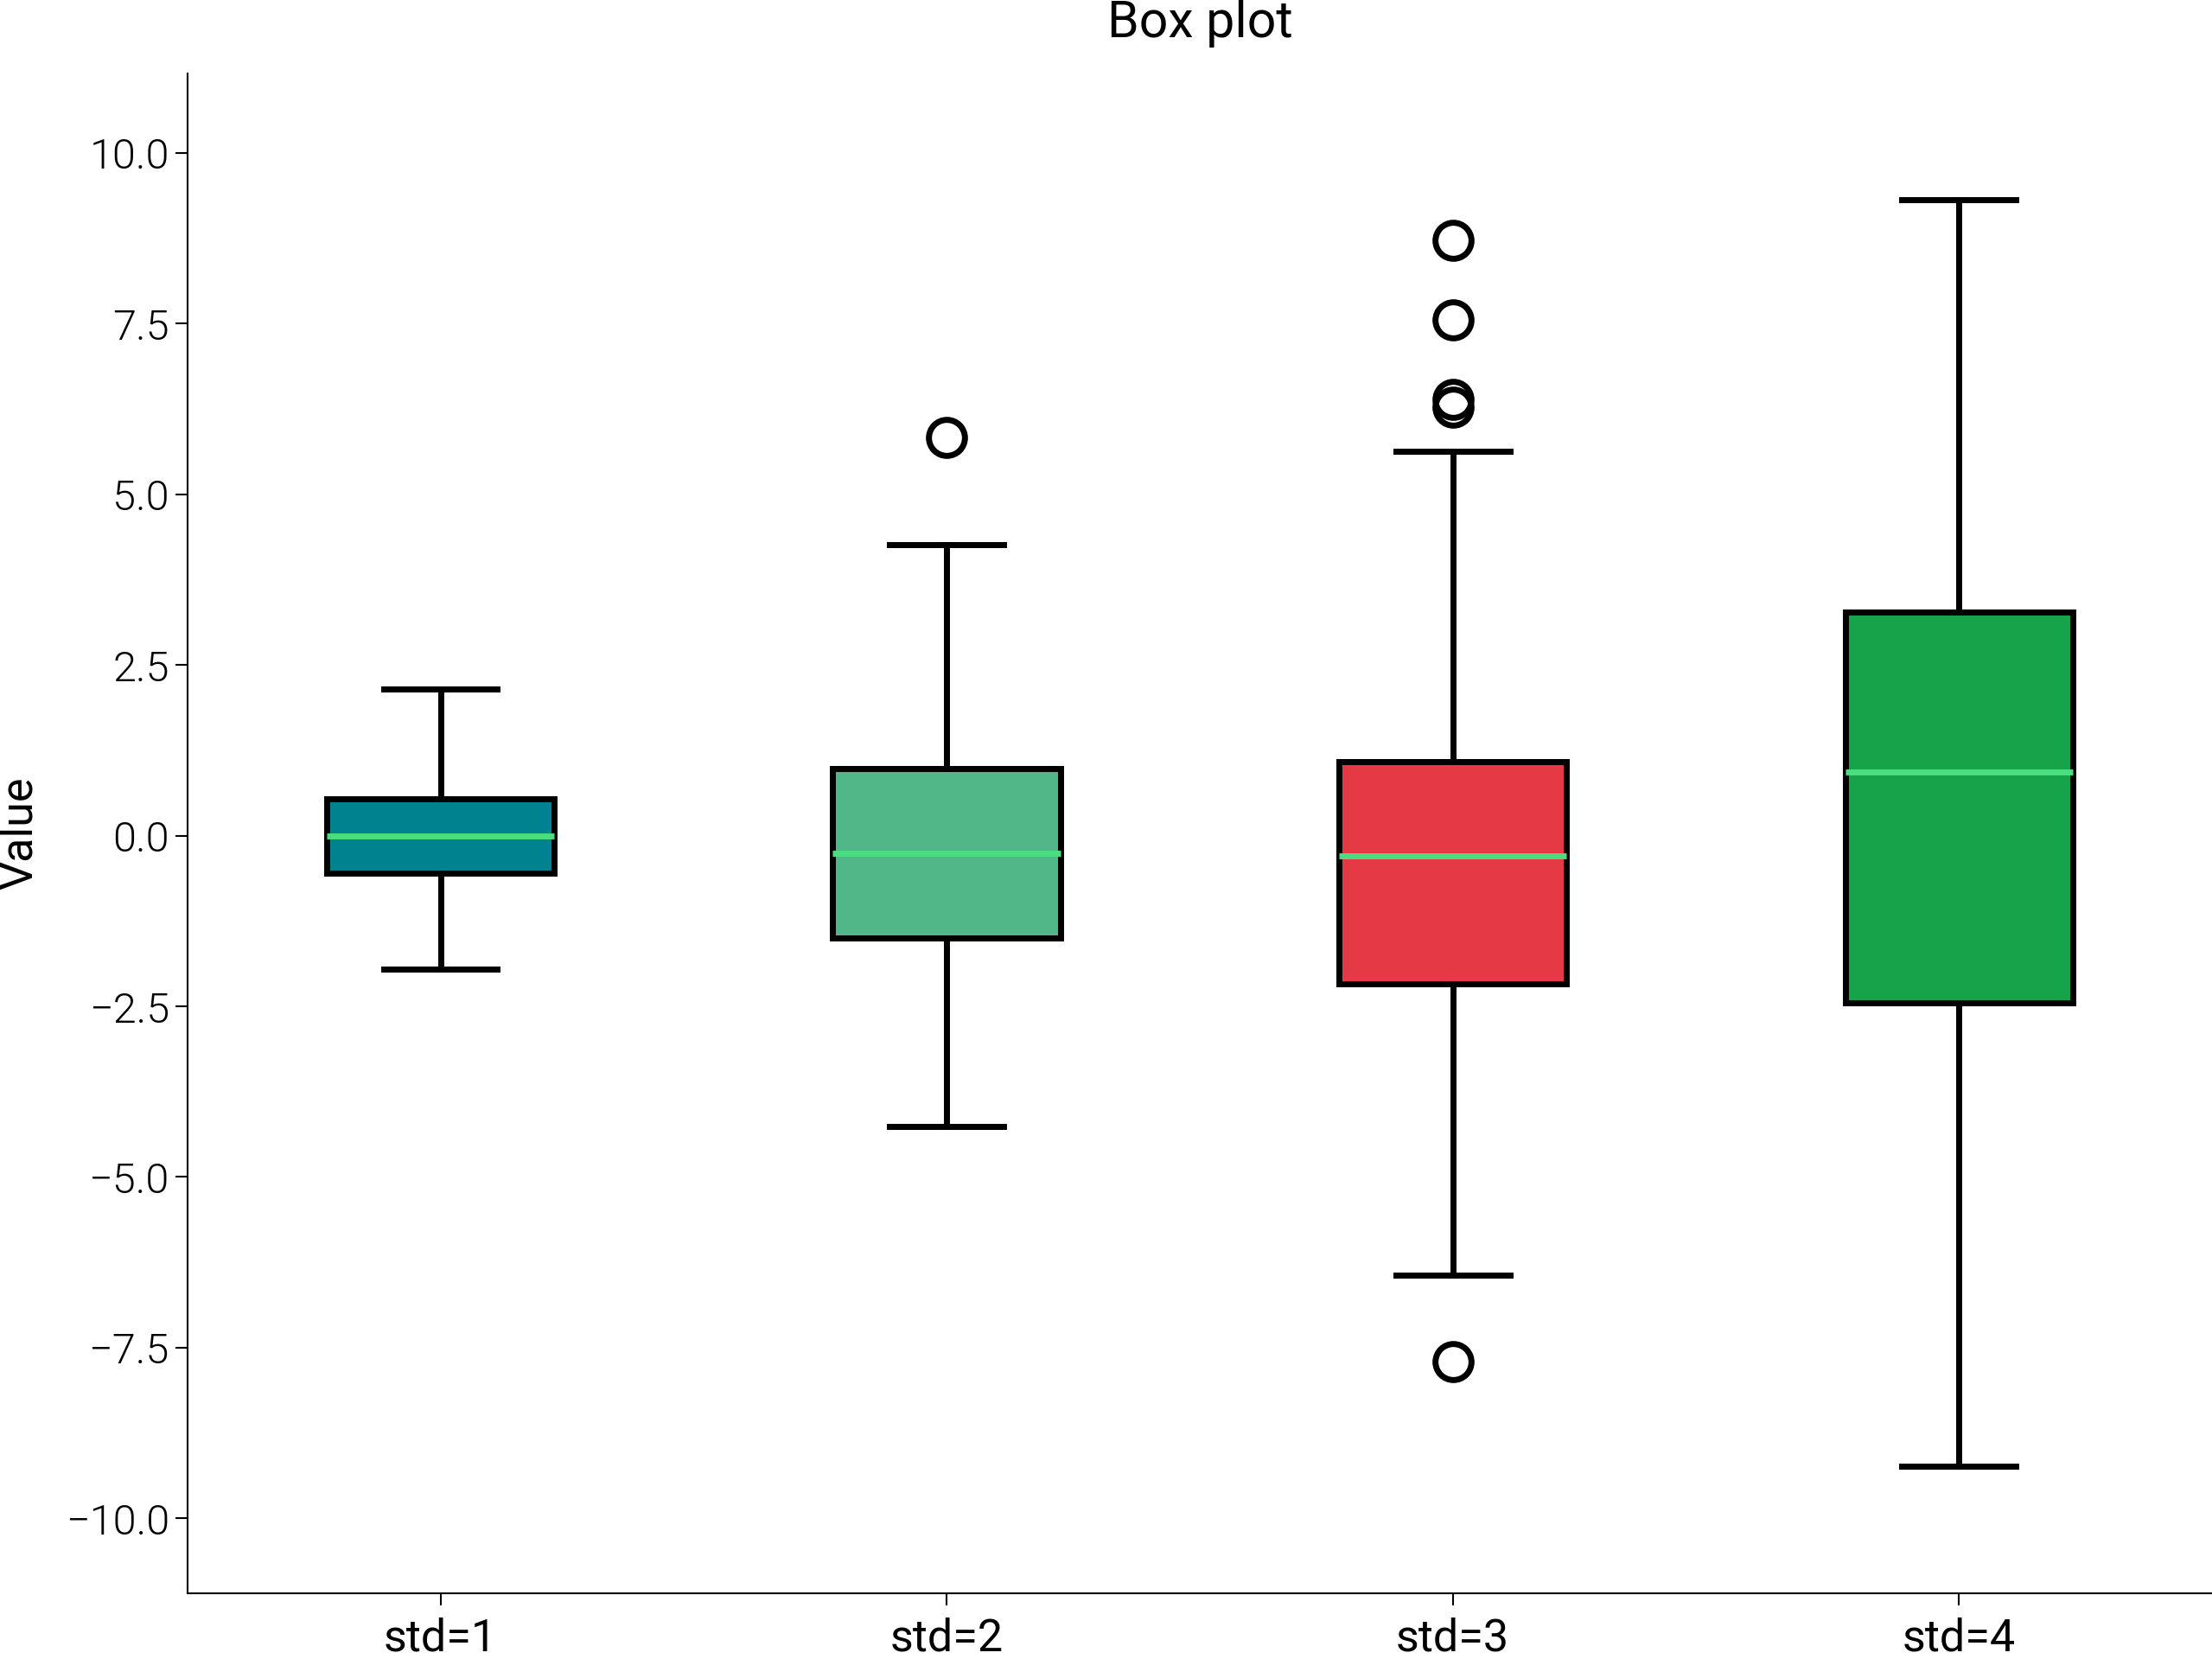
Box plot across four spreads.
Source: dartwork_mpl/asset/prompt/05-templates/boxplot.py ·
dm.get_prompt("05-templates/boxplot") · MCP
dartwork-mpl://templates/boxplot.
# ai-template-meta-start
# use_case: Summarise the distribution of a few numeric groups
# difficulty: intermediate
# data_shape: groups: dict[str, list[float]]
# tags: distribution, boxplot, statistics, summary
# ai-template-meta-end

import matplotlib.pyplot as plt
import numpy as np

import dartwork_mpl as dm

dm.style.use("scientific")

rng = np.random.default_rng(42)
data = [rng.normal(0, std, 100) for std in (1, 2, 3, 4)]
colors = ["dc.teal2", "dc.green2", "dc.orange2", "dc.red2"]

fig, ax = plt.subplots(figsize=dm.figsize("13cm", "standard"))
bp = ax.boxplot(data, patch_artist=True)
for patch, color in zip(bp["boxes"], colors, strict=False):
    patch.set_facecolor(color)
ax.set_xticklabels(["std=1", "std=2", "std=3", "std=4"])
ax.set_ylabel("Value")
ax.set_title("Box plot", fontsize=dm.fs(1), fontweight=dm.fw(1))

dm.simple_layout(fig)
Total running time of the script: (0 minutes 0.362 seconds)