Note
Go to the end to download the full example code.
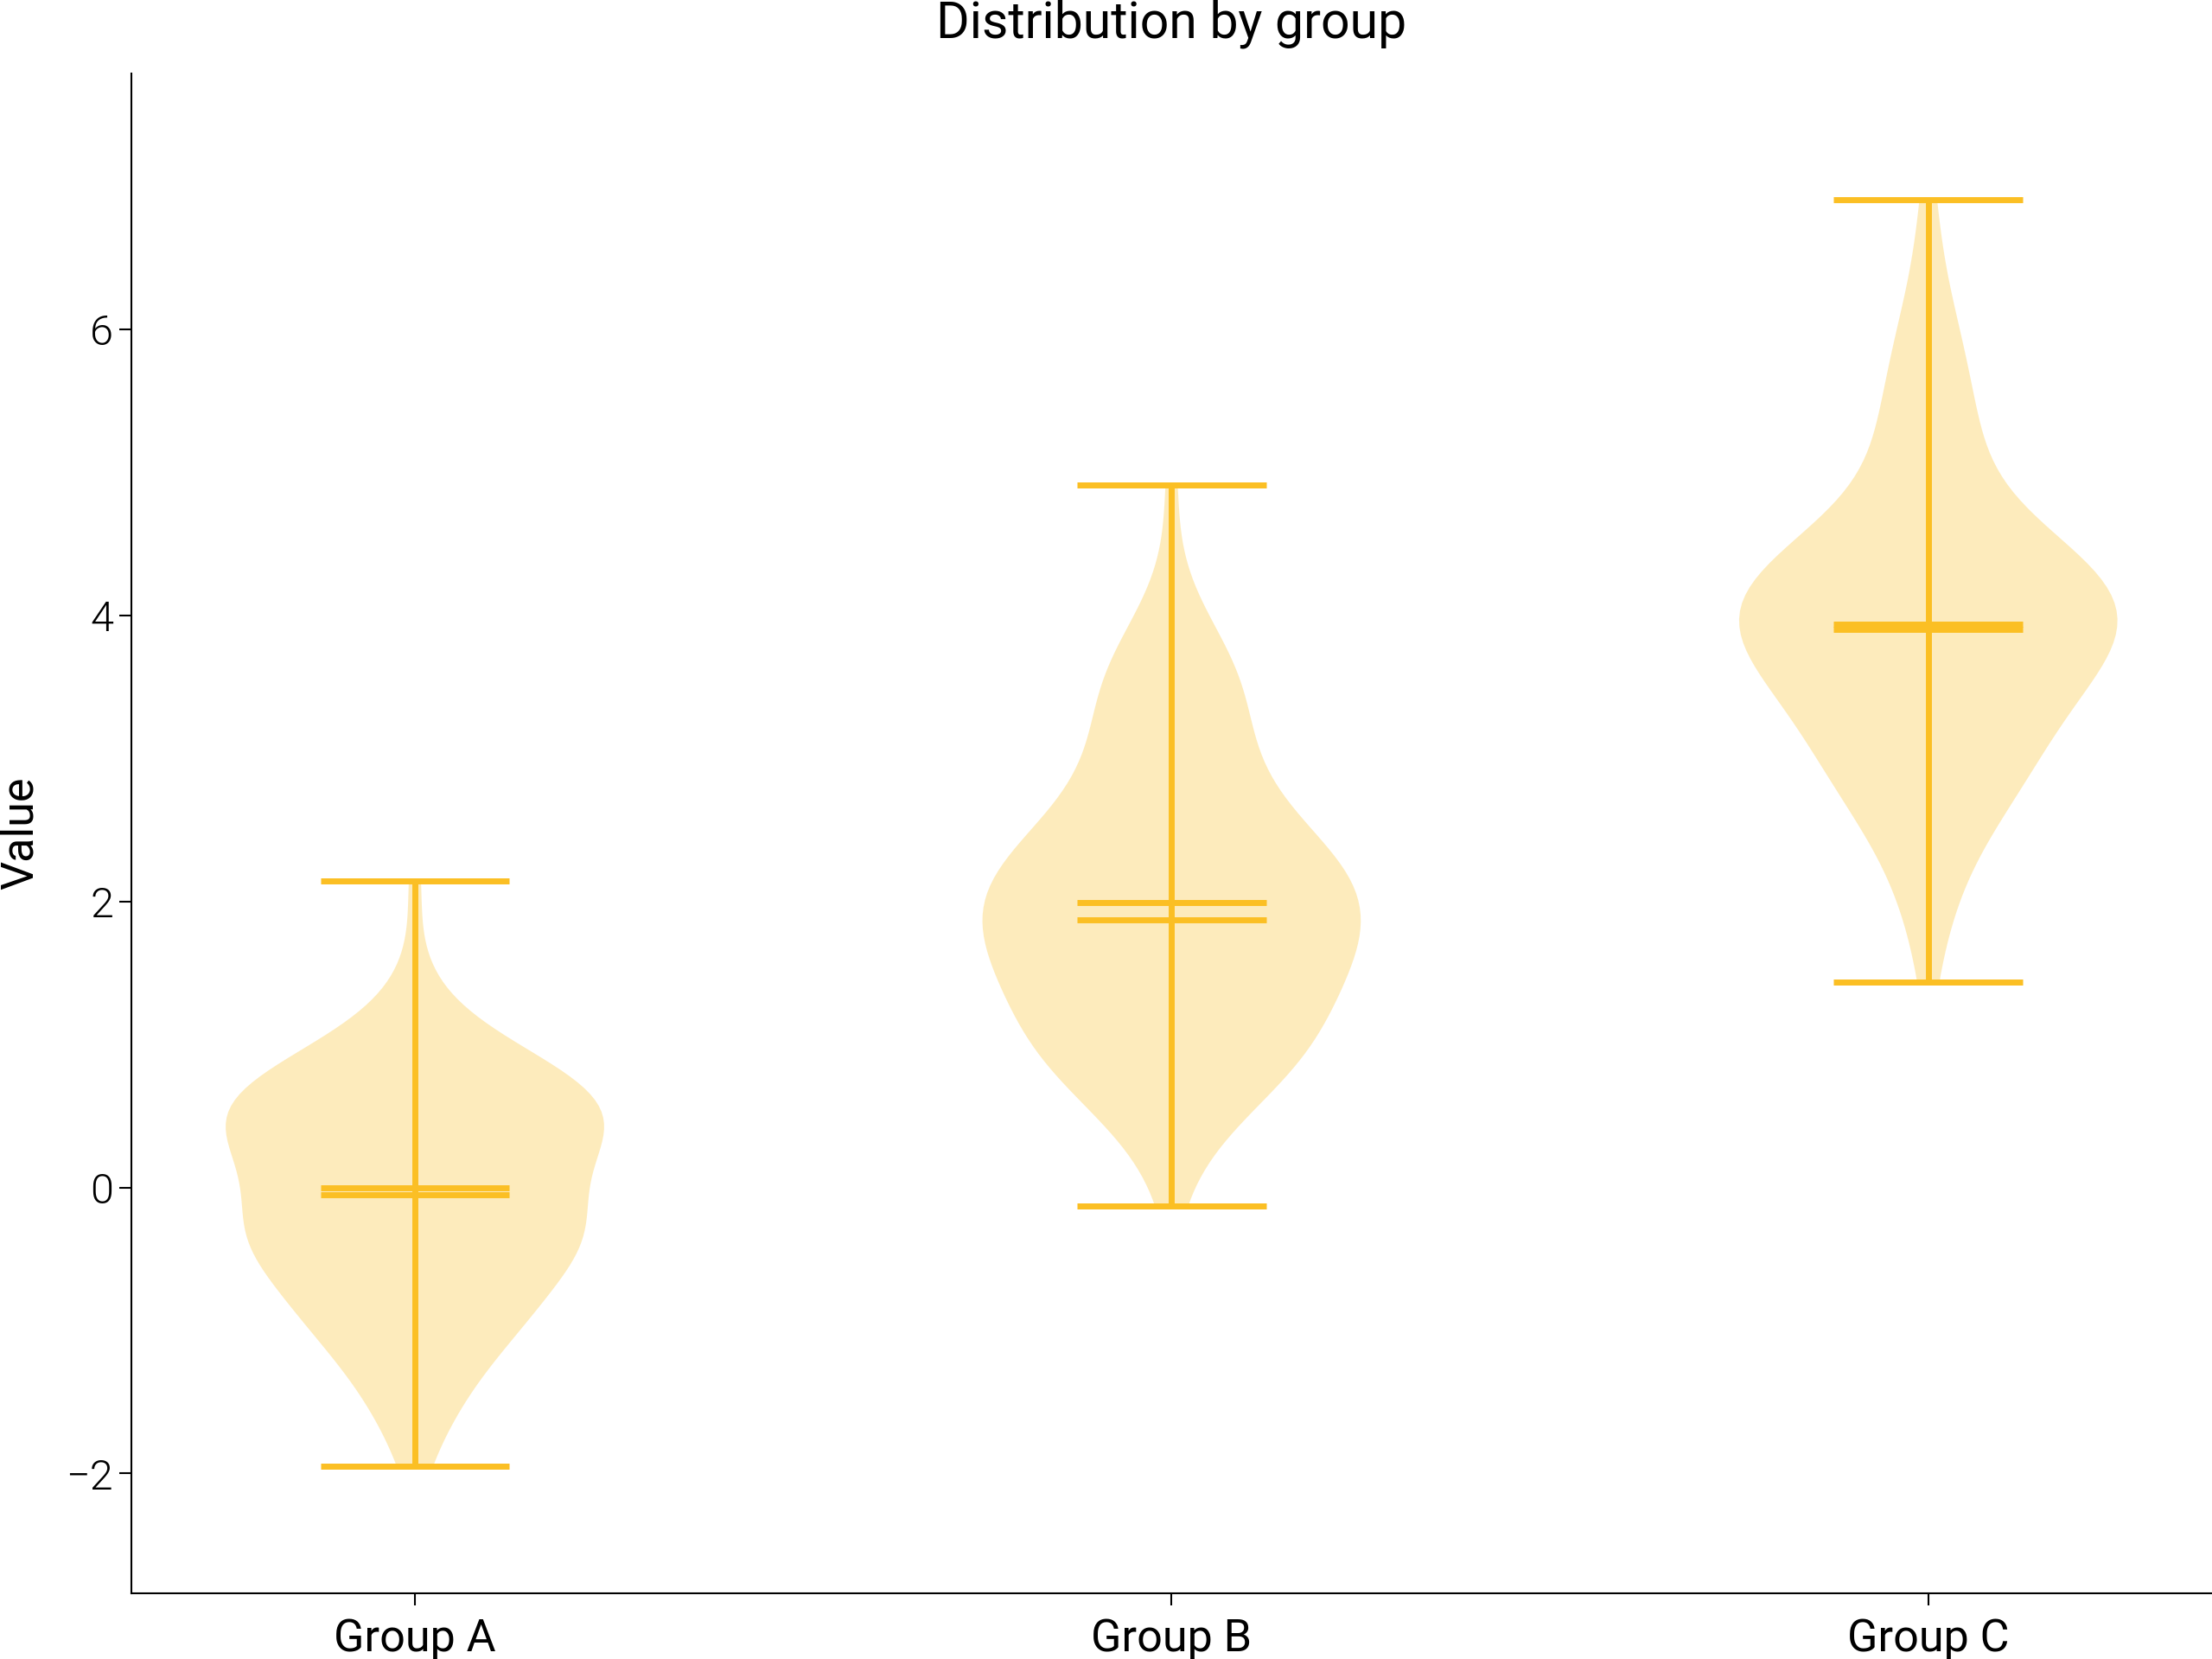
Violin
Violin plot for three groups.
Source: dartwork_mpl/asset/prompt/05-templates/violin.py ·
dm.get_prompt("05-templates/violin") · MCP
dartwork-mpl://templates/violin.
# ai-template-meta-start
# use_case: Show the density of multiple numeric groups
# difficulty: intermediate
# data_shape: groups: dict[str, list[float]]
# tags: distribution, density, violin
# ai-template-meta-end

import matplotlib.pyplot as plt
import numpy as np

import dartwork_mpl as dm

dm.style.use("scientific")

rng = np.random.default_rng(42)
data = [rng.normal(loc, 1, 100) for loc in (0, 2, 4)]

fig, ax = plt.subplots(figsize=dm.figsize("13cm", "standard"))
ax.violinplot(data, showmeans=True, showmedians=True)
ax.set_xticks([1, 2, 3])
ax.set_xticklabels(["Group A", "Group B", "Group C"])
ax.set_ylabel("Value")
ax.set_title("Distribution by group", fontsize=dm.fs(1), fontweight=dm.fw(1))

dm.simple_layout(fig)
Total running time of the script: (0 minutes 0.409 seconds)