Note
Go to the end to download the full example code.
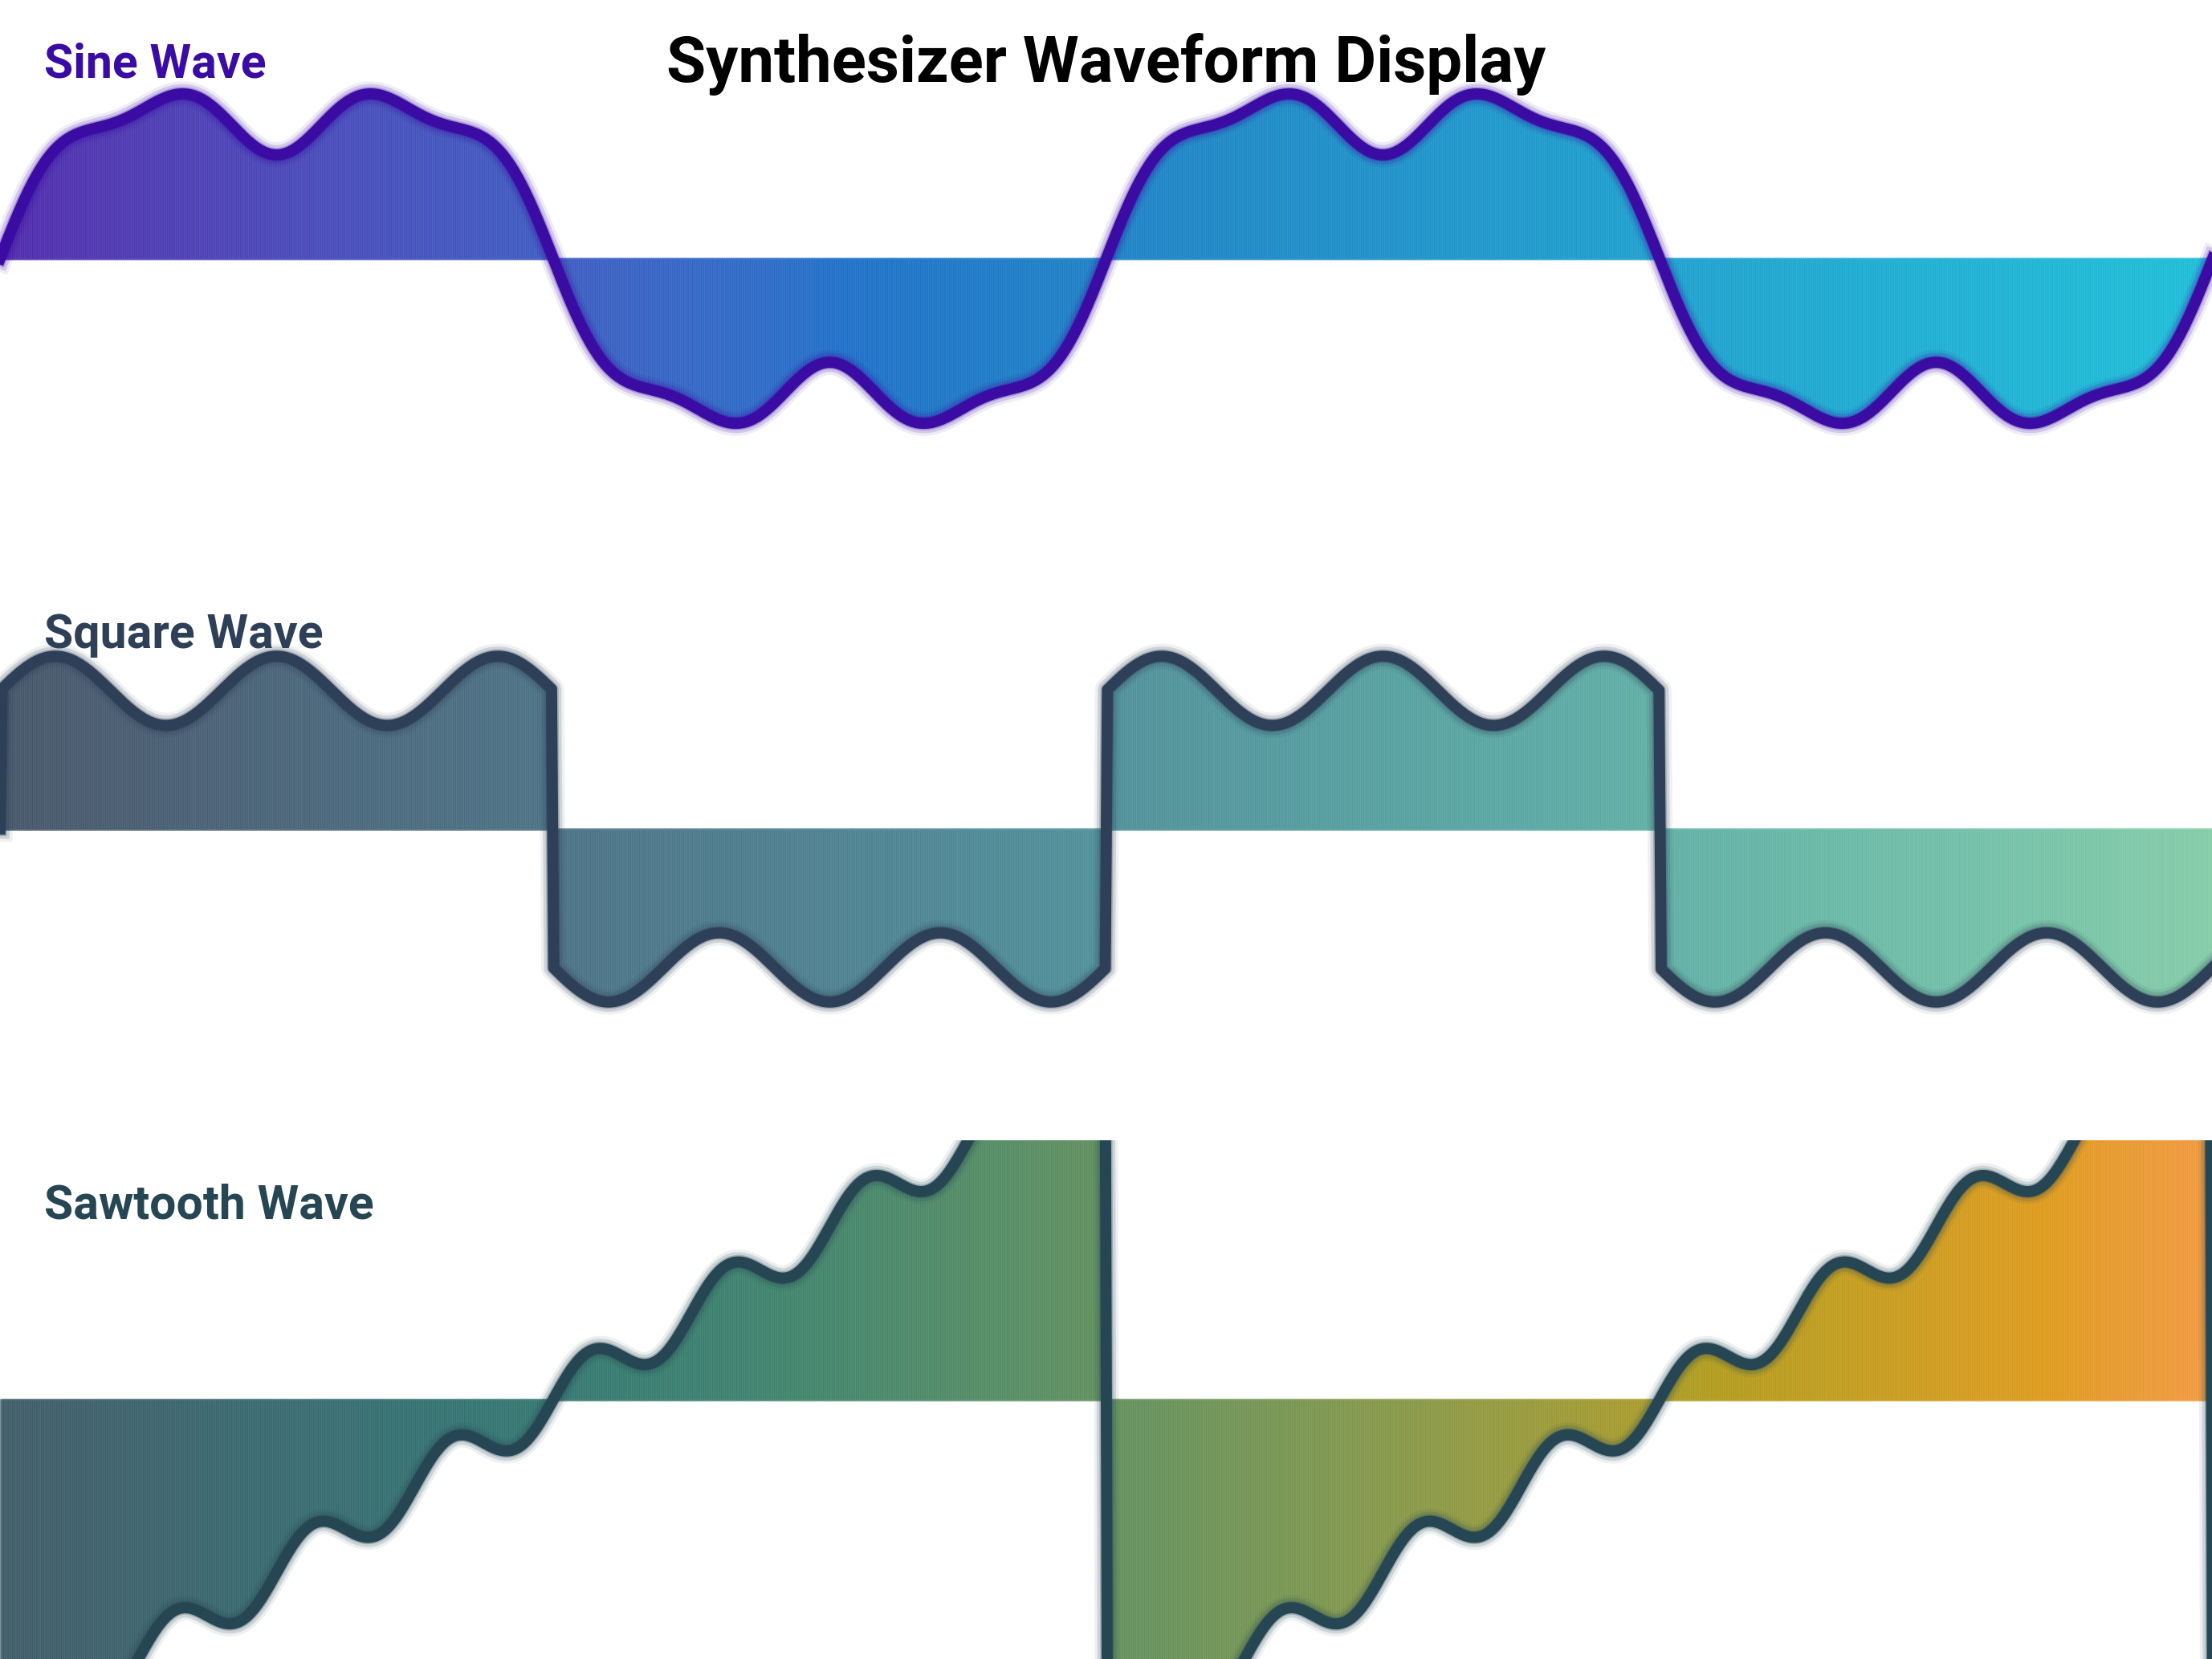
Synthesizer Waveform Display
Three classic synthesizer waveforms — sine, square, and sawtooth — stacked in a single dashboard. Each pane gets:
A gradient fill underneath the wave (
dm.cspaceper channel).A soft halo drawn by stacking three semi-transparent line copies of increasing width before the crisp top line.
Subtle horizontal gridlines for a read-out feel.
The light background keeps the figure consistent with the rest of the gallery while the OKLCH ramps still carry the synth vibe.
import matplotlib.pyplot as plt
import numpy as np

import dartwork_mpl as dm

np.random.seed(42)
dm.style.use("scientific")

fig, axes = plt.subplots(
    3, 1, figsize=dm.figsize("14cm", "standard"), gridspec_kw={"hspace": 0.1}
)

t = np.linspace(0, 4 * np.pi, 1000)

waves = [
    ("Sine Wave", np.sin(t) + 0.3 * np.sin(3 * t) + 0.1 * np.sin(7 * t)),
    ("Square Wave", np.sign(np.sin(t)) * 0.8 + 0.2 * np.sin(5 * t)),
    ("Sawtooth Wave", 2 * (t / np.pi % 2 - 1) + 0.15 * np.sin(8 * t)),
]

color_schemes = [
    dm.cspace("dc.violet5", "dc.red1", n=len(t)),
    dm.cspace("dc.teal5", "dc.green1", n=len(t)),
    dm.cspace("dc.amber5", "dc.orange1", n=len(t)),
]
halo_colors = ["dc.violet5", "dc.teal5", "dc.amber5"]
line_colors = ["dc.violet5", "dc.teal5", "dc.amber5"]

for ax, (name, wave), colors, halo, line in zip(
    axes, waves, color_schemes, halo_colors, line_colors, strict=False
):
    for i in range(len(t) - 1):
        ax.fill_between(
            [t[i], t[i + 1]],
            0,
            [wave[i], wave[i + 1]],
            color=colors[i].to_hex(),
            alpha=0.45,
        )

    for offset, alpha in [(3, 0.08), (2, 0.16), (1, 0.28)]:
        ax.plot(t, wave, color=halo, lw=dm.lw(0.5) + offset, alpha=alpha)
    ax.plot(t, wave, color=line, lw=dm.lw(1))

    ax.text(
        0.02,
        0.85,
        name,
        transform=ax.transAxes,
        fontsize=dm.fs(1),
        color=line,
        weight="bold",
    )

    ax.set_xlim(0, 4 * np.pi)
    ax.set_ylim(-1.5, 1.5)
    for s in ax.spines.values():
        s.set_visible(False)
    ax.set_xticks([])
    ax.set_yticks([])

    for y in np.linspace(-1.5, 1.5, 7):
        ax.axhline(y, color="dc.indigo2", lw=dm.lw(-1), alpha=0.5)

fig.suptitle(
    "Synthesizer Waveform Display", fontsize=dm.fs(4), weight="bold", y=0.98
)

dm.simple_layout(fig)
plt.show()
Total running time of the script: (0 minutes 7.918 seconds)