Note
Go to the end to download the full example code.
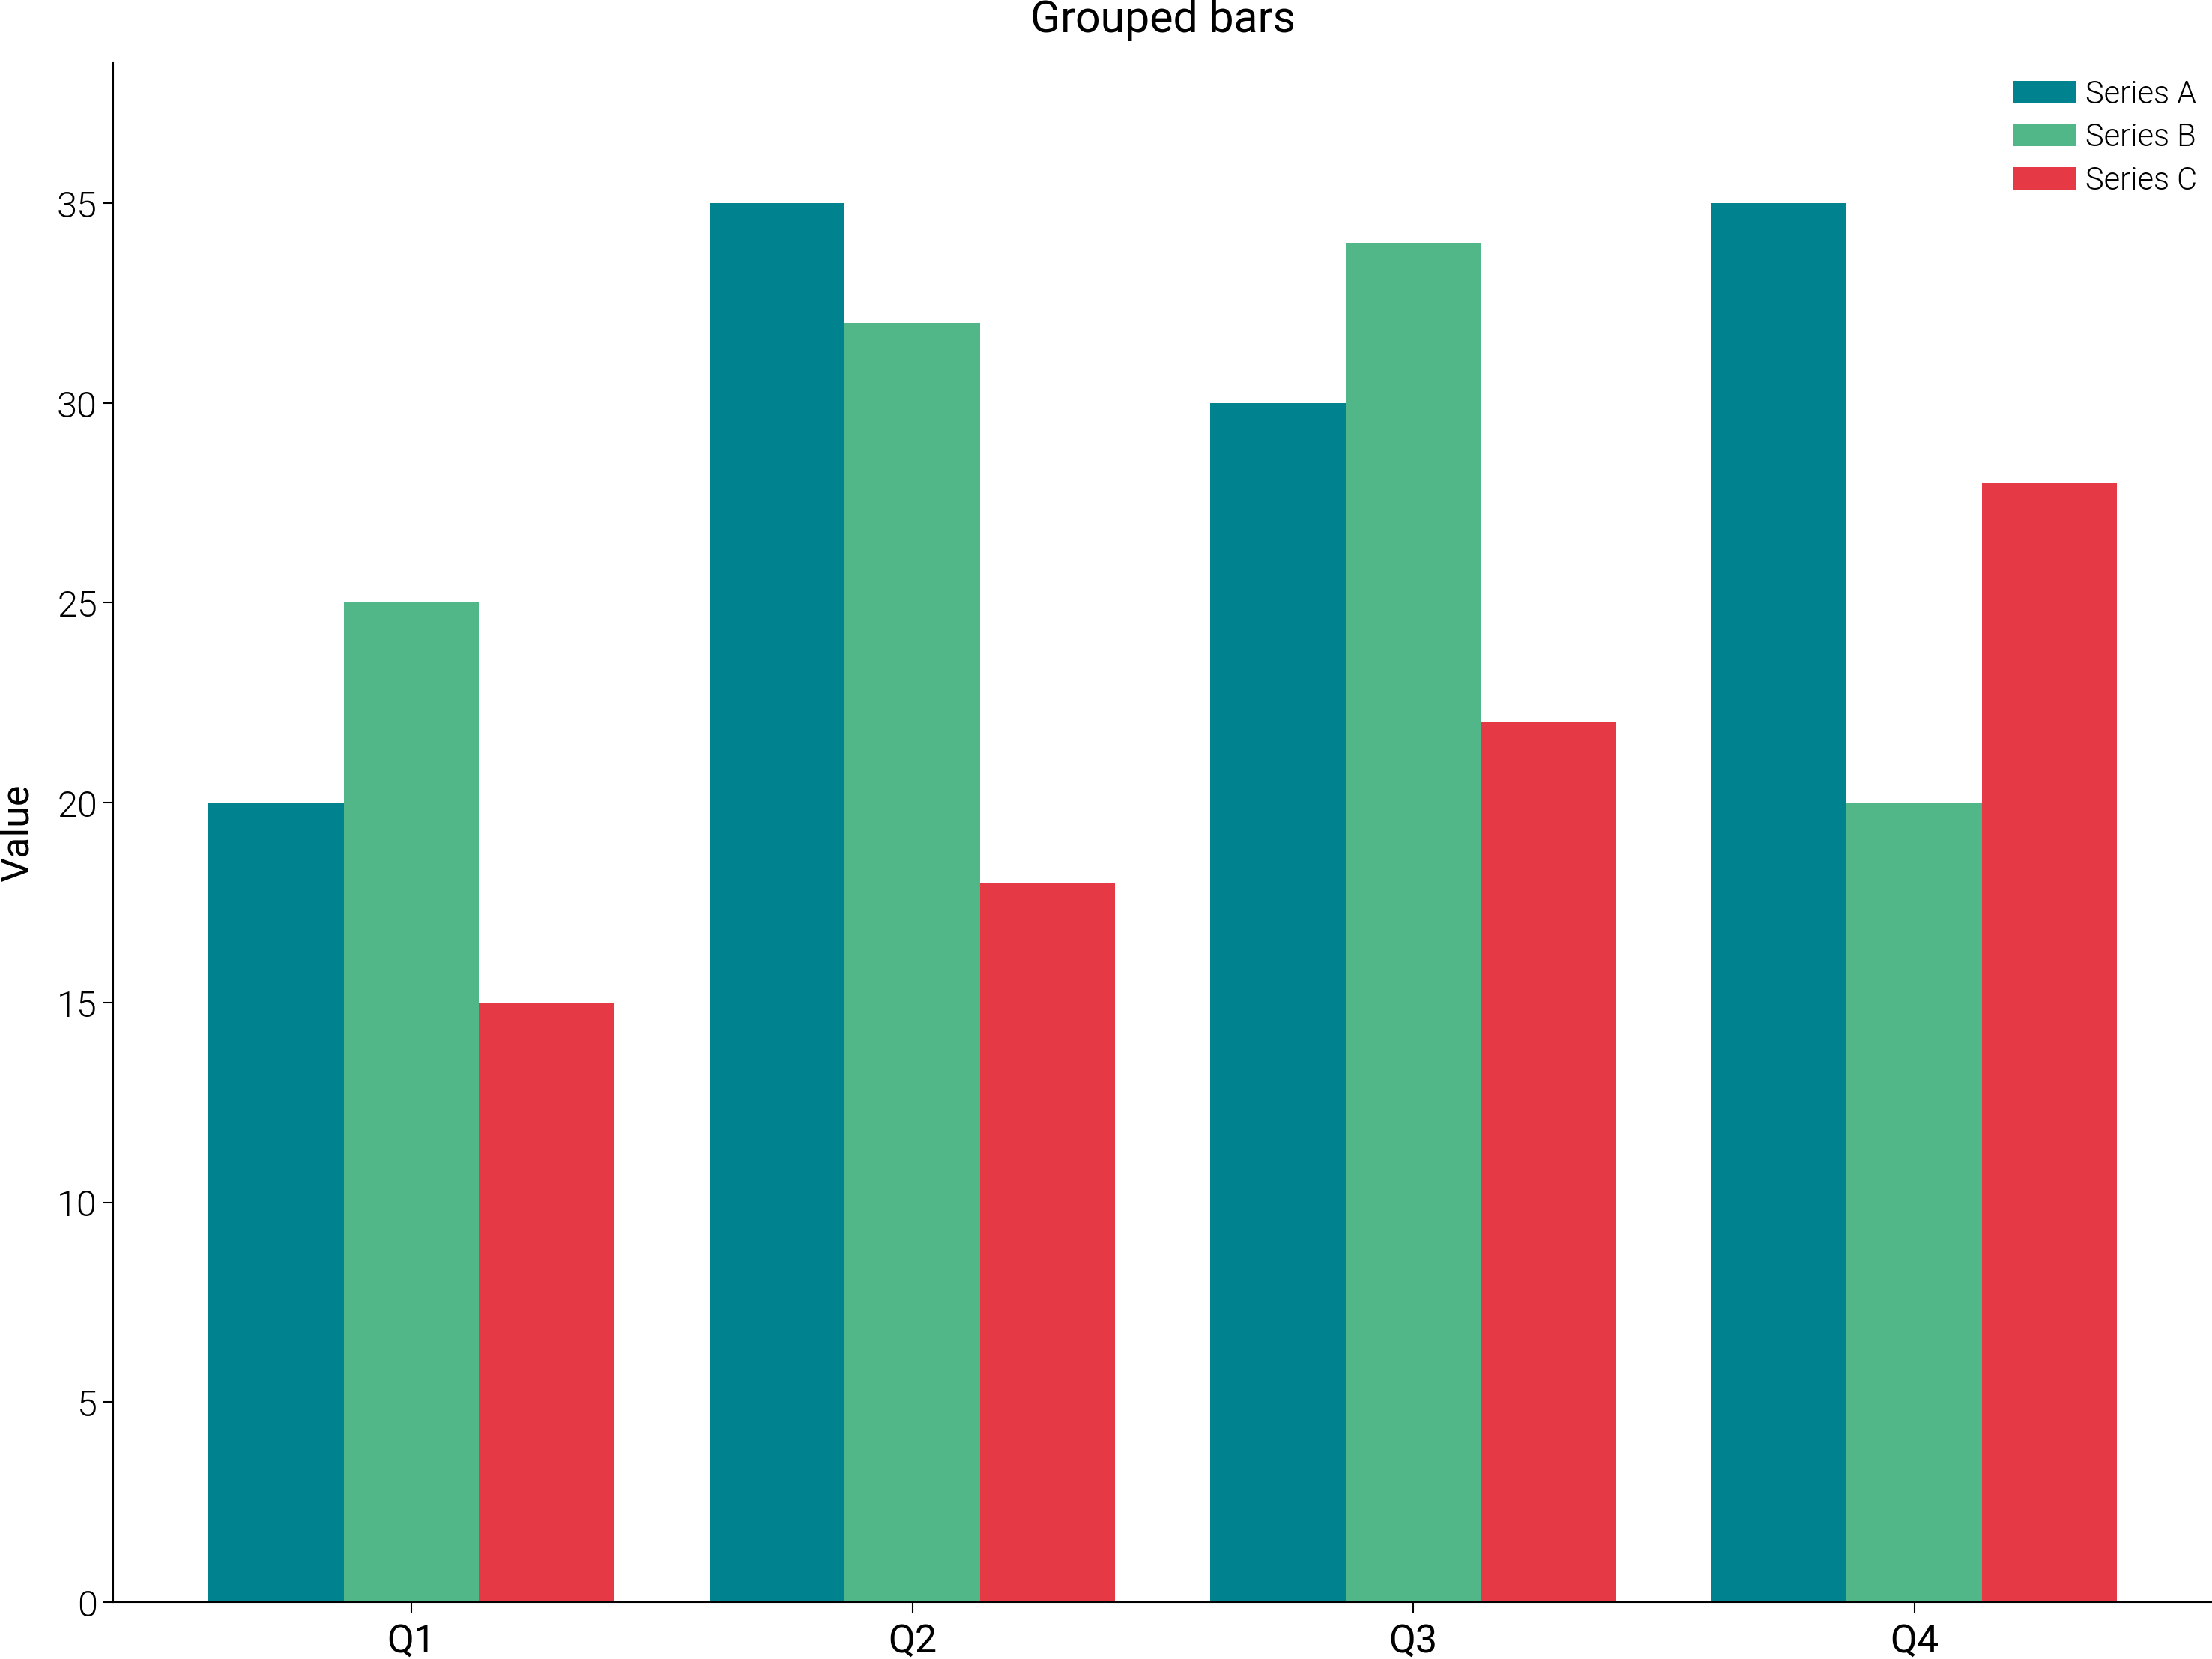
Bar (grouped)
Grouped (dodged) bar chart with three series per category.
Source: dartwork_mpl/asset/prompt/05-templates/bar_grouped.py ·
dm.get_prompt("05-templates/bar_grouped") · MCP
dartwork-mpl://templates/bar_grouped.
# ai-template-meta-start
# use_case: Compare multiple series across the same categories
# difficulty: intermediate
# data_shape: categories: list[str], series: dict[str, list[float]]
# tags: bar, grouped, multi-series, comparison
# ai-template-meta-end

import matplotlib.pyplot as plt
import numpy as np

import dartwork_mpl as dm

dm.style.use("scientific")

categories = ["Q1", "Q2", "Q3", "Q4"]
series_a = [20, 35, 30, 35]
series_b = [25, 32, 34, 20]
series_c = [15, 18, 22, 28]

fig, ax = plt.subplots(figsize=dm.figsize("15cm", "standard"))
x = np.arange(len(categories))
bar_width = 0.27
ax.bar(x - bar_width, series_a, bar_width, label="Series A", color="dc.teal2")
ax.bar(x, series_b, bar_width, label="Series B", color="dc.green2")
ax.bar(x + bar_width, series_c, bar_width, label="Series C", color="dc.orange2")
ax.set_xticks(x)
ax.set_xticklabels(categories)
ax.set_ylabel("Value")
ax.legend()
ax.set_title("Grouped bars", fontsize=dm.fs(1), fontweight=dm.fw(1))

dm.simple_layout(fig)
Total running time of the script: (0 minutes 0.455 seconds)