Note
Go to the end to download the full example code.
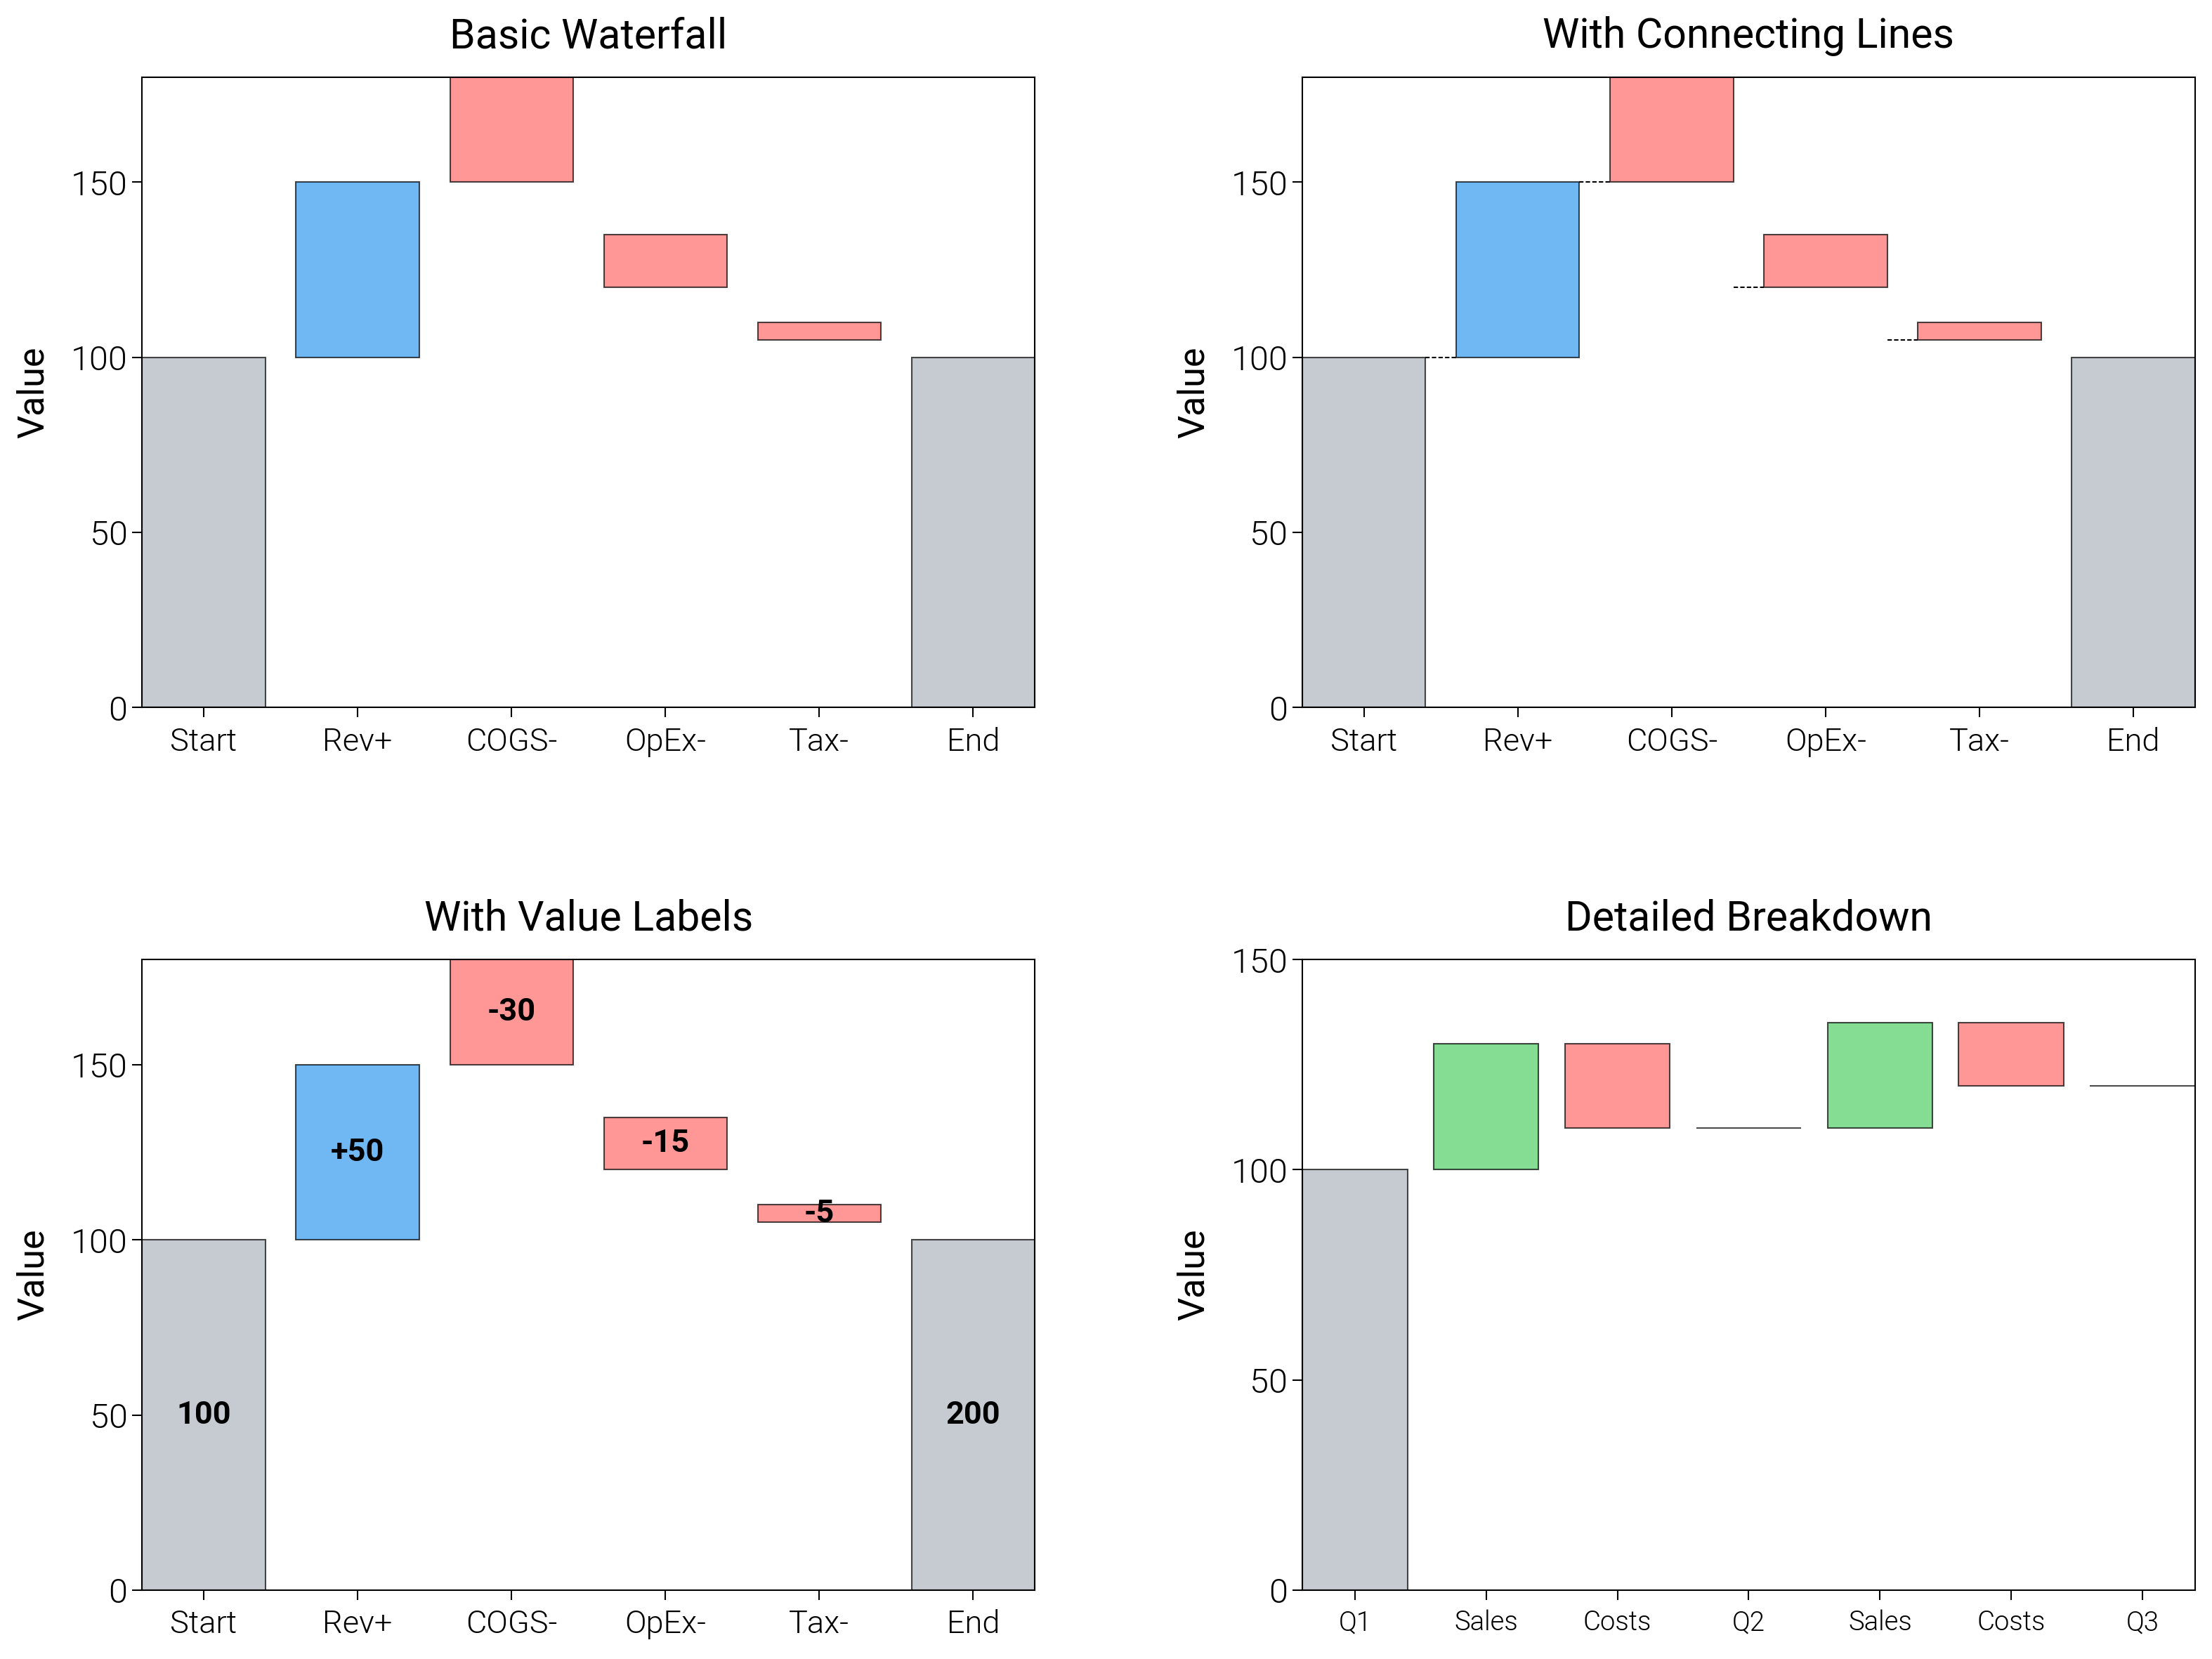
Waterfall
Waterfall (bridge) chart - start, deltas, end.
Source: dartwork_mpl/asset/prompt/05-templates/waterfall.py ·
dm.get_prompt("05-templates/waterfall") · MCP
dartwork-mpl://templates/waterfall.
# ai-template-meta-start
# use_case: Show successive additive contributions to a total
# difficulty: advanced
# data_shape: labels: list[str], deltas: list[float]
# tags: waterfall, bridge, finance, additive
# ai-template-meta-end

import matplotlib.pyplot as plt
import numpy as np

import dartwork_mpl as dm

dm.style.use("scientific")

labels = ["Start", "Gain A", "Loss B", "Gain C", "Loss D", "End"]
deltas = [100, 30, -15, 25, -20, 0]
is_total = [True, False, False, False, False, True]

# Compute baselines and bar heights for each step.
baselines = np.zeros(len(deltas))
heights = np.zeros(len(deltas))
running = 0.0
for i, (delta, total) in enumerate(zip(deltas, is_total, strict=False)):
    if total:
        if i == 0:
            running = delta
        baselines[i] = 0
        heights[i] = running
    else:
        baselines[i] = running + min(delta, 0)
        heights[i] = abs(delta)
        running += delta

colors = [
    "dc.indigo3" if total else ("dc.green2" if d >= 0 else "dc.red2")
    for d, total in zip(deltas, is_total, strict=False)
]

fig, ax = plt.subplots(figsize=dm.figsize("15cm", "standard"))
ax.bar(
    labels,
    heights,
    bottom=baselines,
    color=colors,
    edgecolor="white",
    linewidth=0.3,
)
ax.axhline(0, color="dc.indigo3", linewidth=0.3)
ax.set_ylabel("Value")
ax.set_title("Bridge / waterfall", fontsize=dm.fs(1), fontweight=dm.fw(1))

dm.simple_layout(fig)
Total running time of the script: (0 minutes 0.421 seconds)