Note
Go to the end to download the full example code.
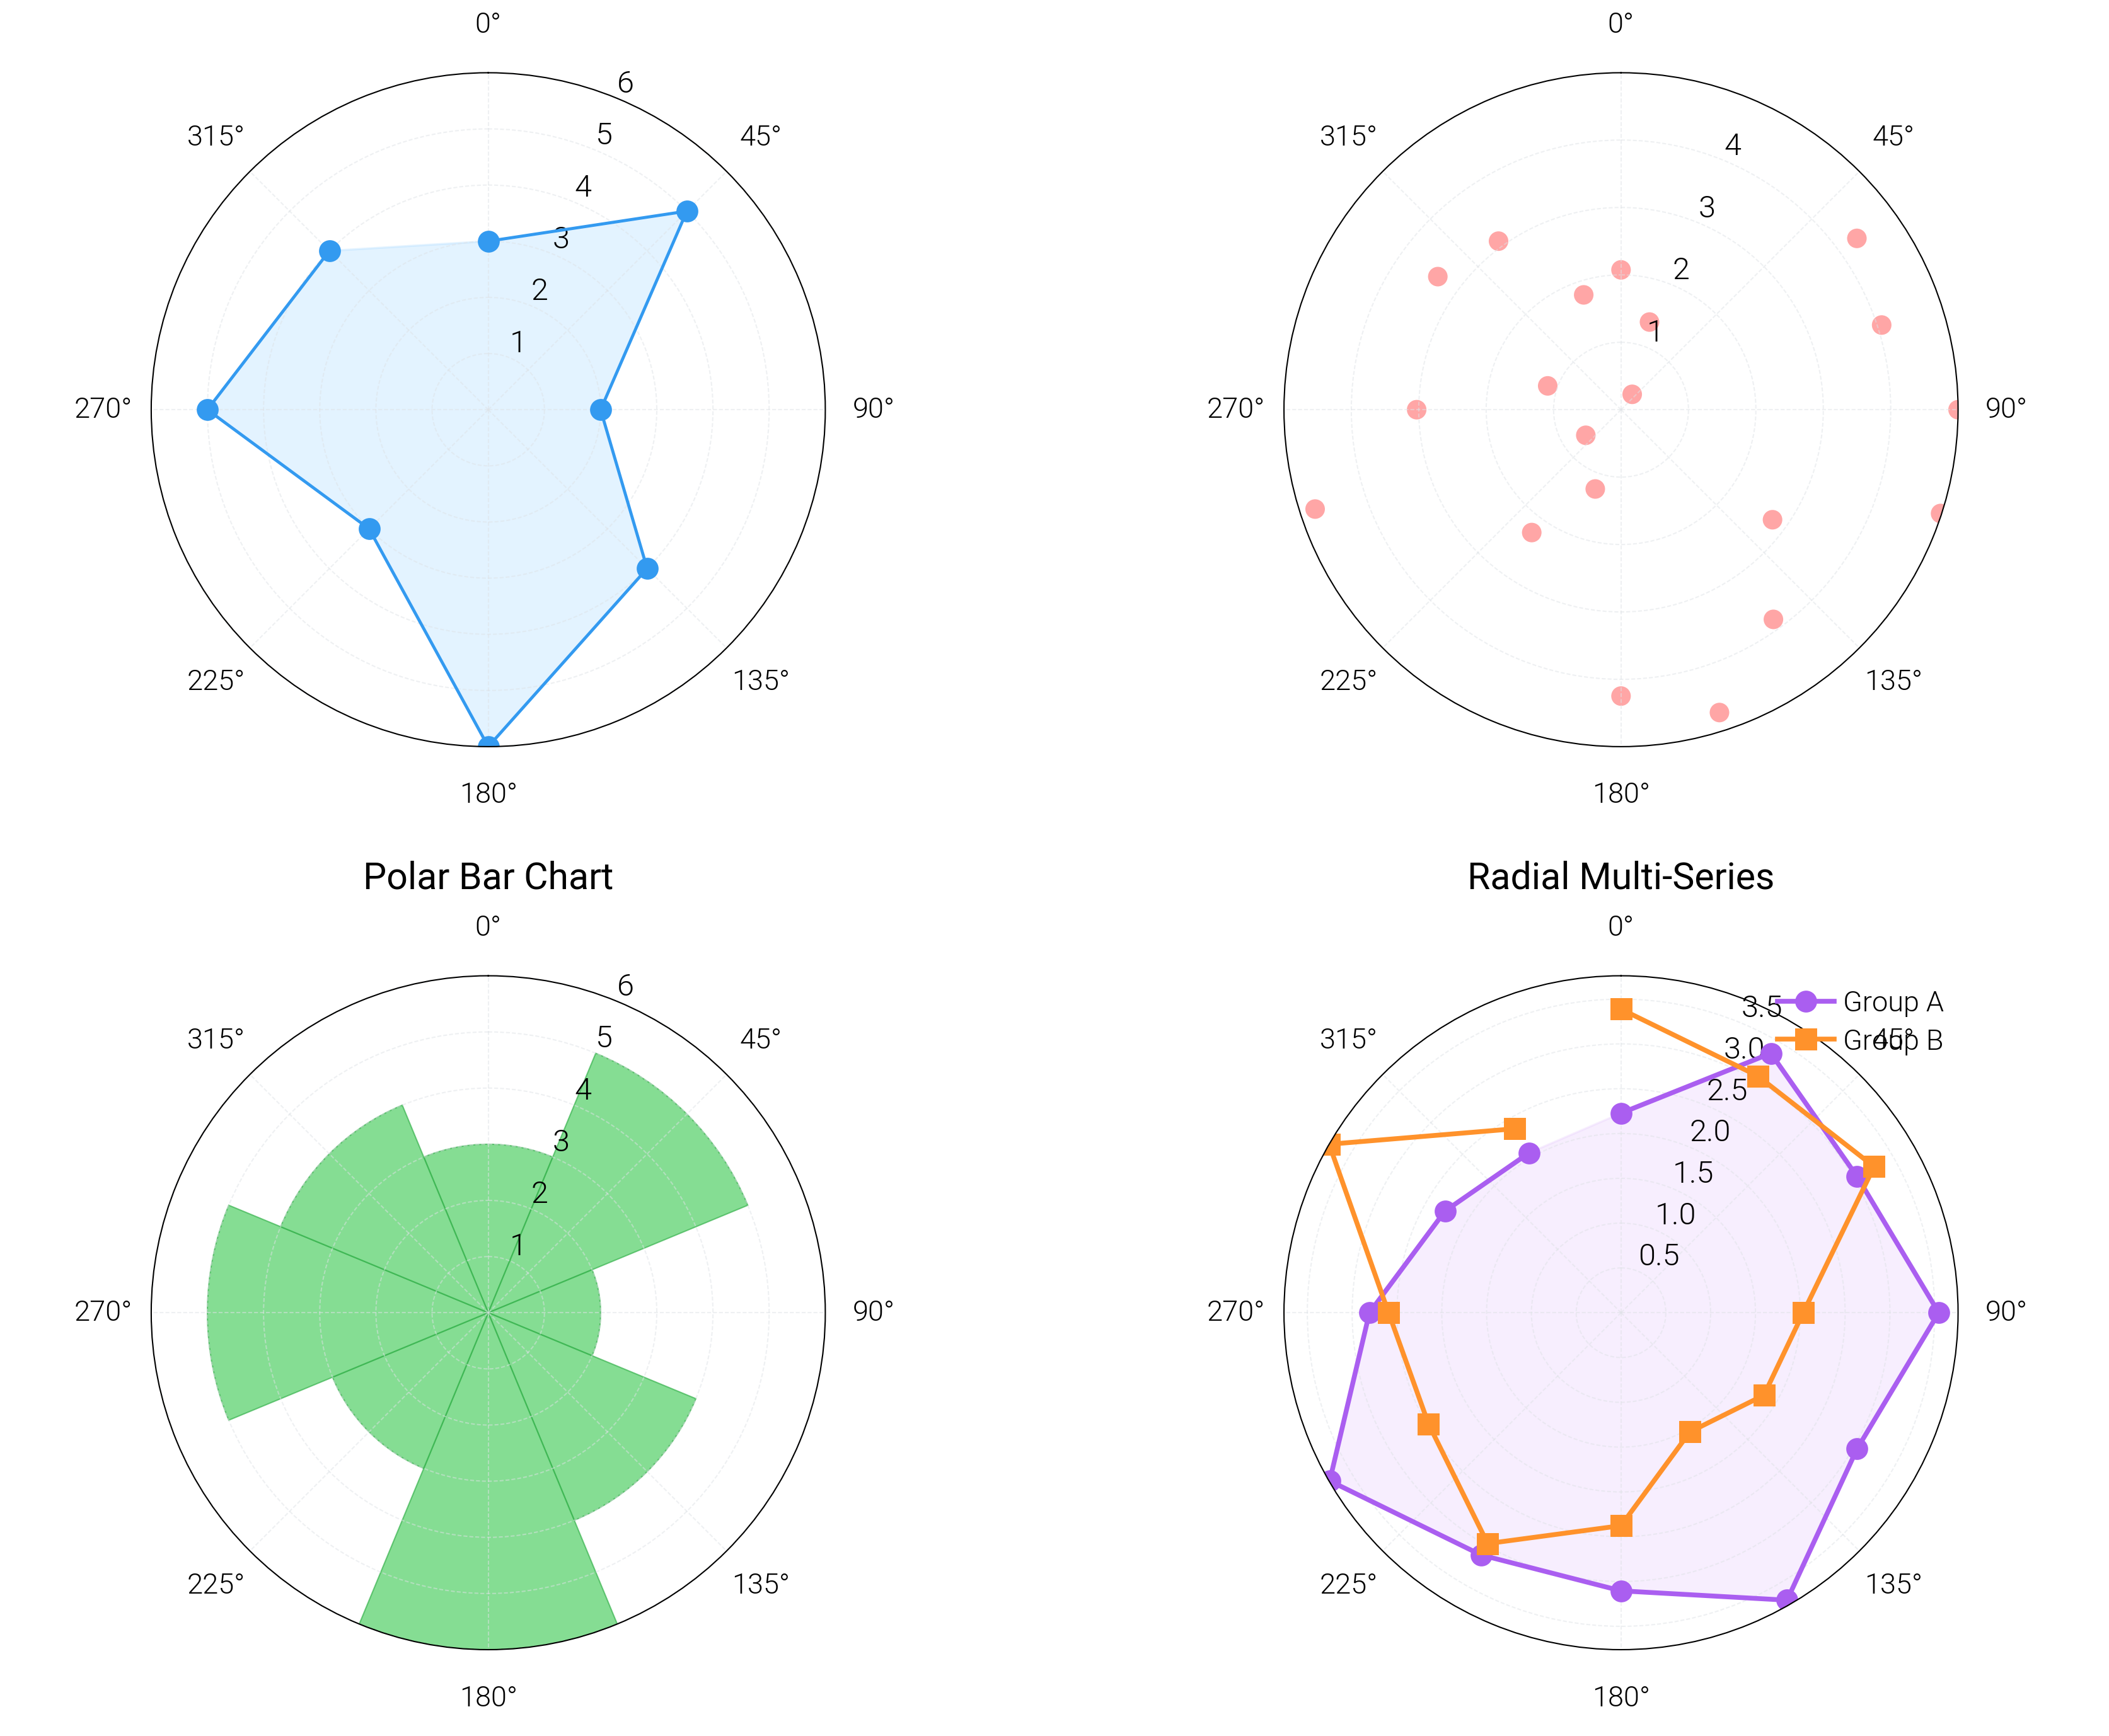
Polar / radar
Polar / radar chart - closed loop on angular axis.
Source: dartwork_mpl/asset/prompt/05-templates/polar.py ·
dm.get_prompt("05-templates/polar") · MCP dartwork-mpl://templates/polar.
# ai-template-meta-start
# use_case: Show angular or radial data on a polar plot
# difficulty: intermediate
# data_shape: theta: list[float], r: list[float]
# tags: polar, radial, angular, compass
# ai-template-meta-end

import matplotlib.pyplot as plt
import numpy as np

import dartwork_mpl as dm

dm.style.use("scientific")

categories = ["Speed", "Cost", "Quality", "Reach", "Trust", "Service"]
values_a = [4.0, 3.2, 4.5, 2.8, 4.1, 3.5]
values_b = [3.0, 4.5, 3.0, 4.0, 3.2, 4.2]

theta = np.linspace(0, 2 * np.pi, len(categories), endpoint=False)
# Close the loop for radar plotting.
theta_closed = np.concatenate([theta, theta[:1]])
a_closed = values_a + values_a[:1]
b_closed = values_b + values_b[:1]

fig, ax = plt.subplots(
    figsize=dm.figsize("11cm", "square"), subplot_kw={"projection": "polar"}
)
ax.plot(
    theta_closed, a_closed, color="dc.teal3", linewidth=dm.lw(0), label="Plan A"
)
ax.fill(theta_closed, a_closed, color="dc.teal1", alpha=0.3)
ax.plot(
    theta_closed,
    b_closed,
    color="dc.orange3",
    linewidth=dm.lw(0),
    label="Plan B",
)
ax.fill(theta_closed, b_closed, color="dc.red1", alpha=0.3)
ax.set_xticks(theta)
ax.set_xticklabels(categories)
ax.set_ylim(0, 5)
ax.legend(loc="upper right", bbox_to_anchor=(1.25, 1.1))
ax.set_title("Radar comparison", fontsize=dm.fs(1), fontweight=dm.fw(1))

dm.simple_layout(fig)
Total running time of the script: (0 minutes 0.592 seconds)