Note
Go to the end to download the full example code.
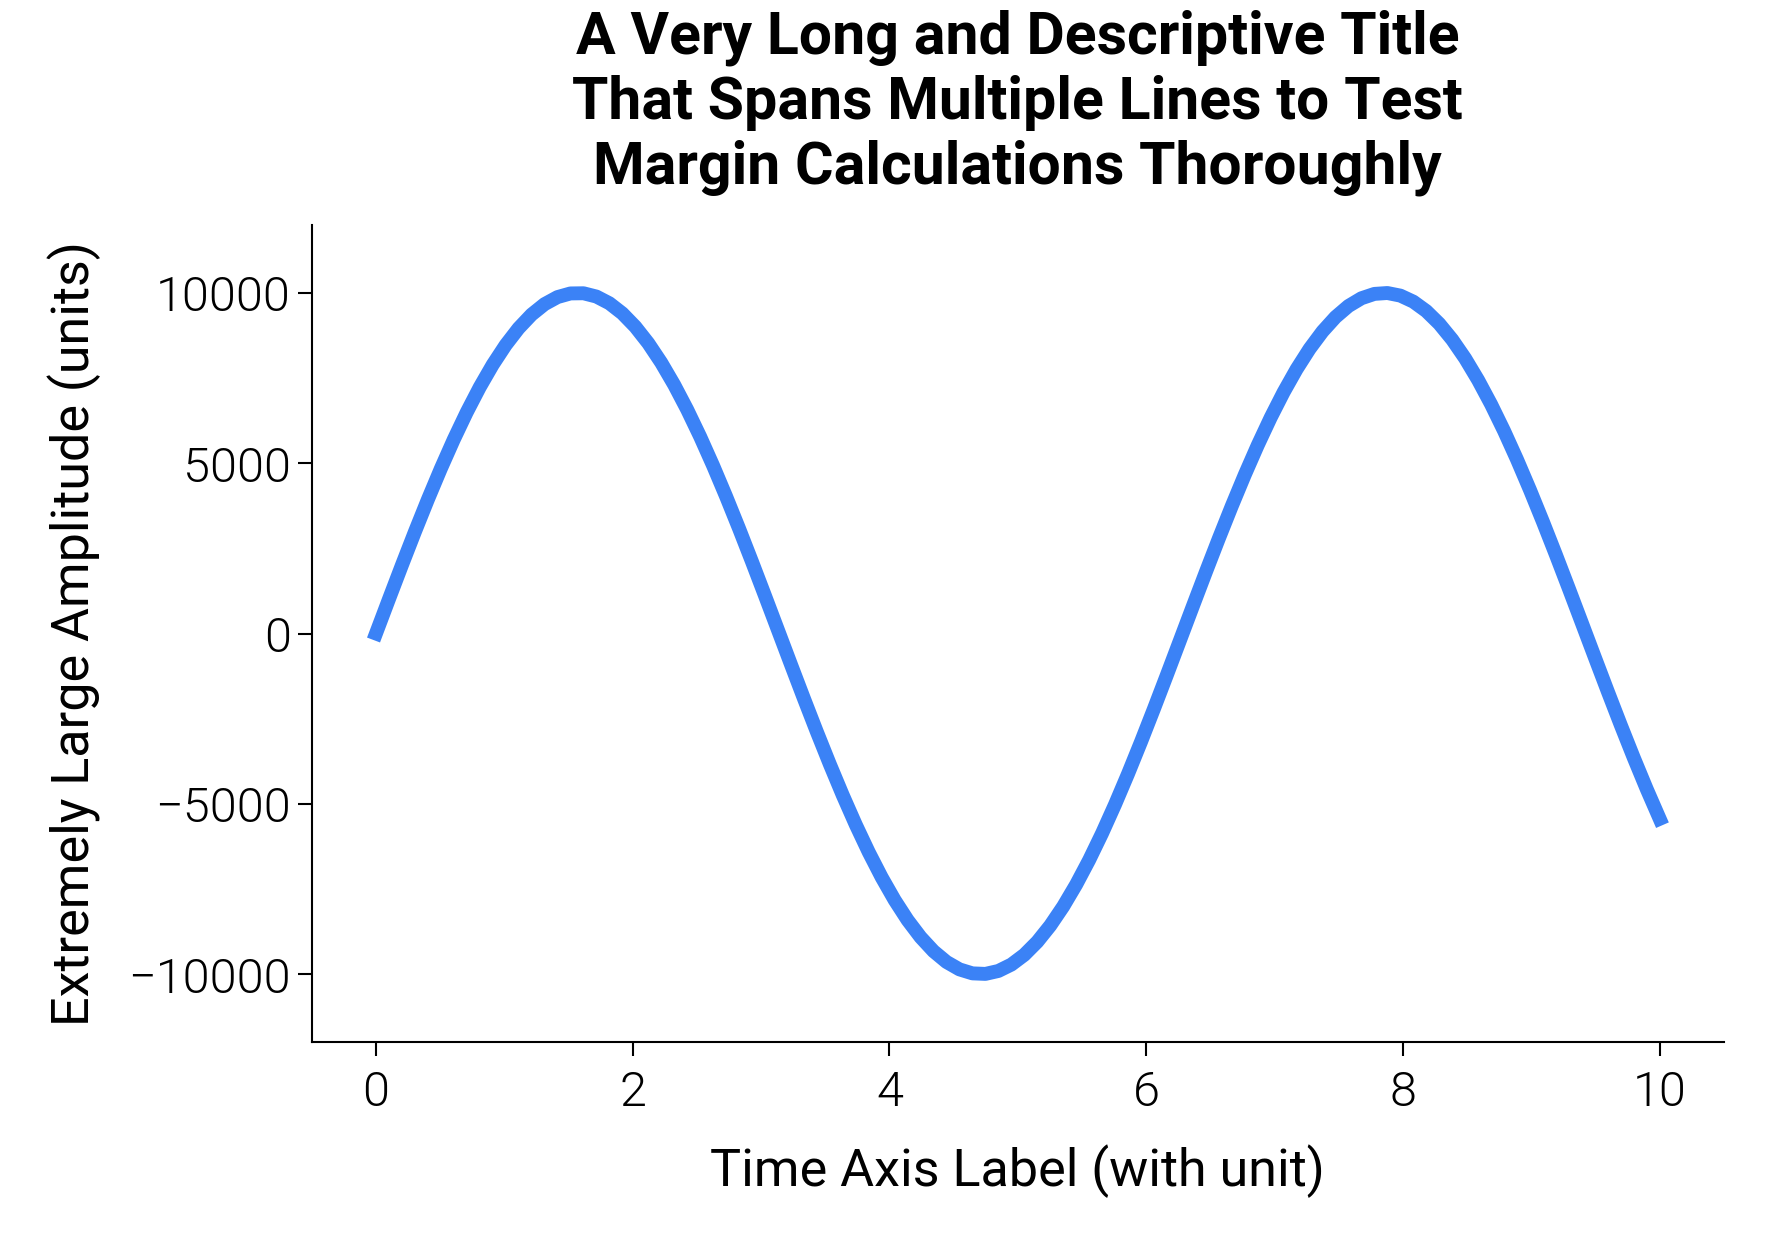
Simple Layout: multi-line titles & wide labels
dm.simple_layout(fig) measures every visible artist on every axes
and arithmetically places the GridSpec so the content union sits flush
against the figure edges (or a requested margin). No optimizer and no
tight_layout guesswork is involved — it is a direct measure→place
calculation, so multi-line titles and wide y-labels stop clipping
without bleeding excess whitespace.
Pass gs= for a custom GridSpec (spans, nested grids, attached
colorbars); pass margin= (a Length, a
percentage string, or per-side ml / mr / mt / mb) to add
a uniform buffer instead of a flush fit.
import matplotlib.pyplot as plt
import numpy as np

import dartwork_mpl as dm

dm.style.use("scientific")

# 9 cm × standard is the academic single-column default
# (also available as dm.col1).
fig, ax = plt.subplots(figsize=dm.figsize("9cm", "standard"))

x = np.linspace(0, 10, 100)
ax.plot(x, np.sin(x) * 10000, color="tw.blue500", lw=dm.lw(1))

ax.set_title(
    "A Very Long and Descriptive Title\nThat Spans Multiple Lines to Test\nMargin Calculations Thoroughly"
)
ax.set_xlabel("Time Axis Label (with unit)")
ax.set_ylabel("Extremely Large Amplitude (units)")

# simple_layout handles multi-line titles and wide labels; for uniform
# grids, prefer dm.simple_layout(fig) which iterates simple_layout.
dm.simple_layout(fig)
plt.show()
Total running time of the script: (0 minutes 0.276 seconds)