Note
Go to the end to download the full example code.
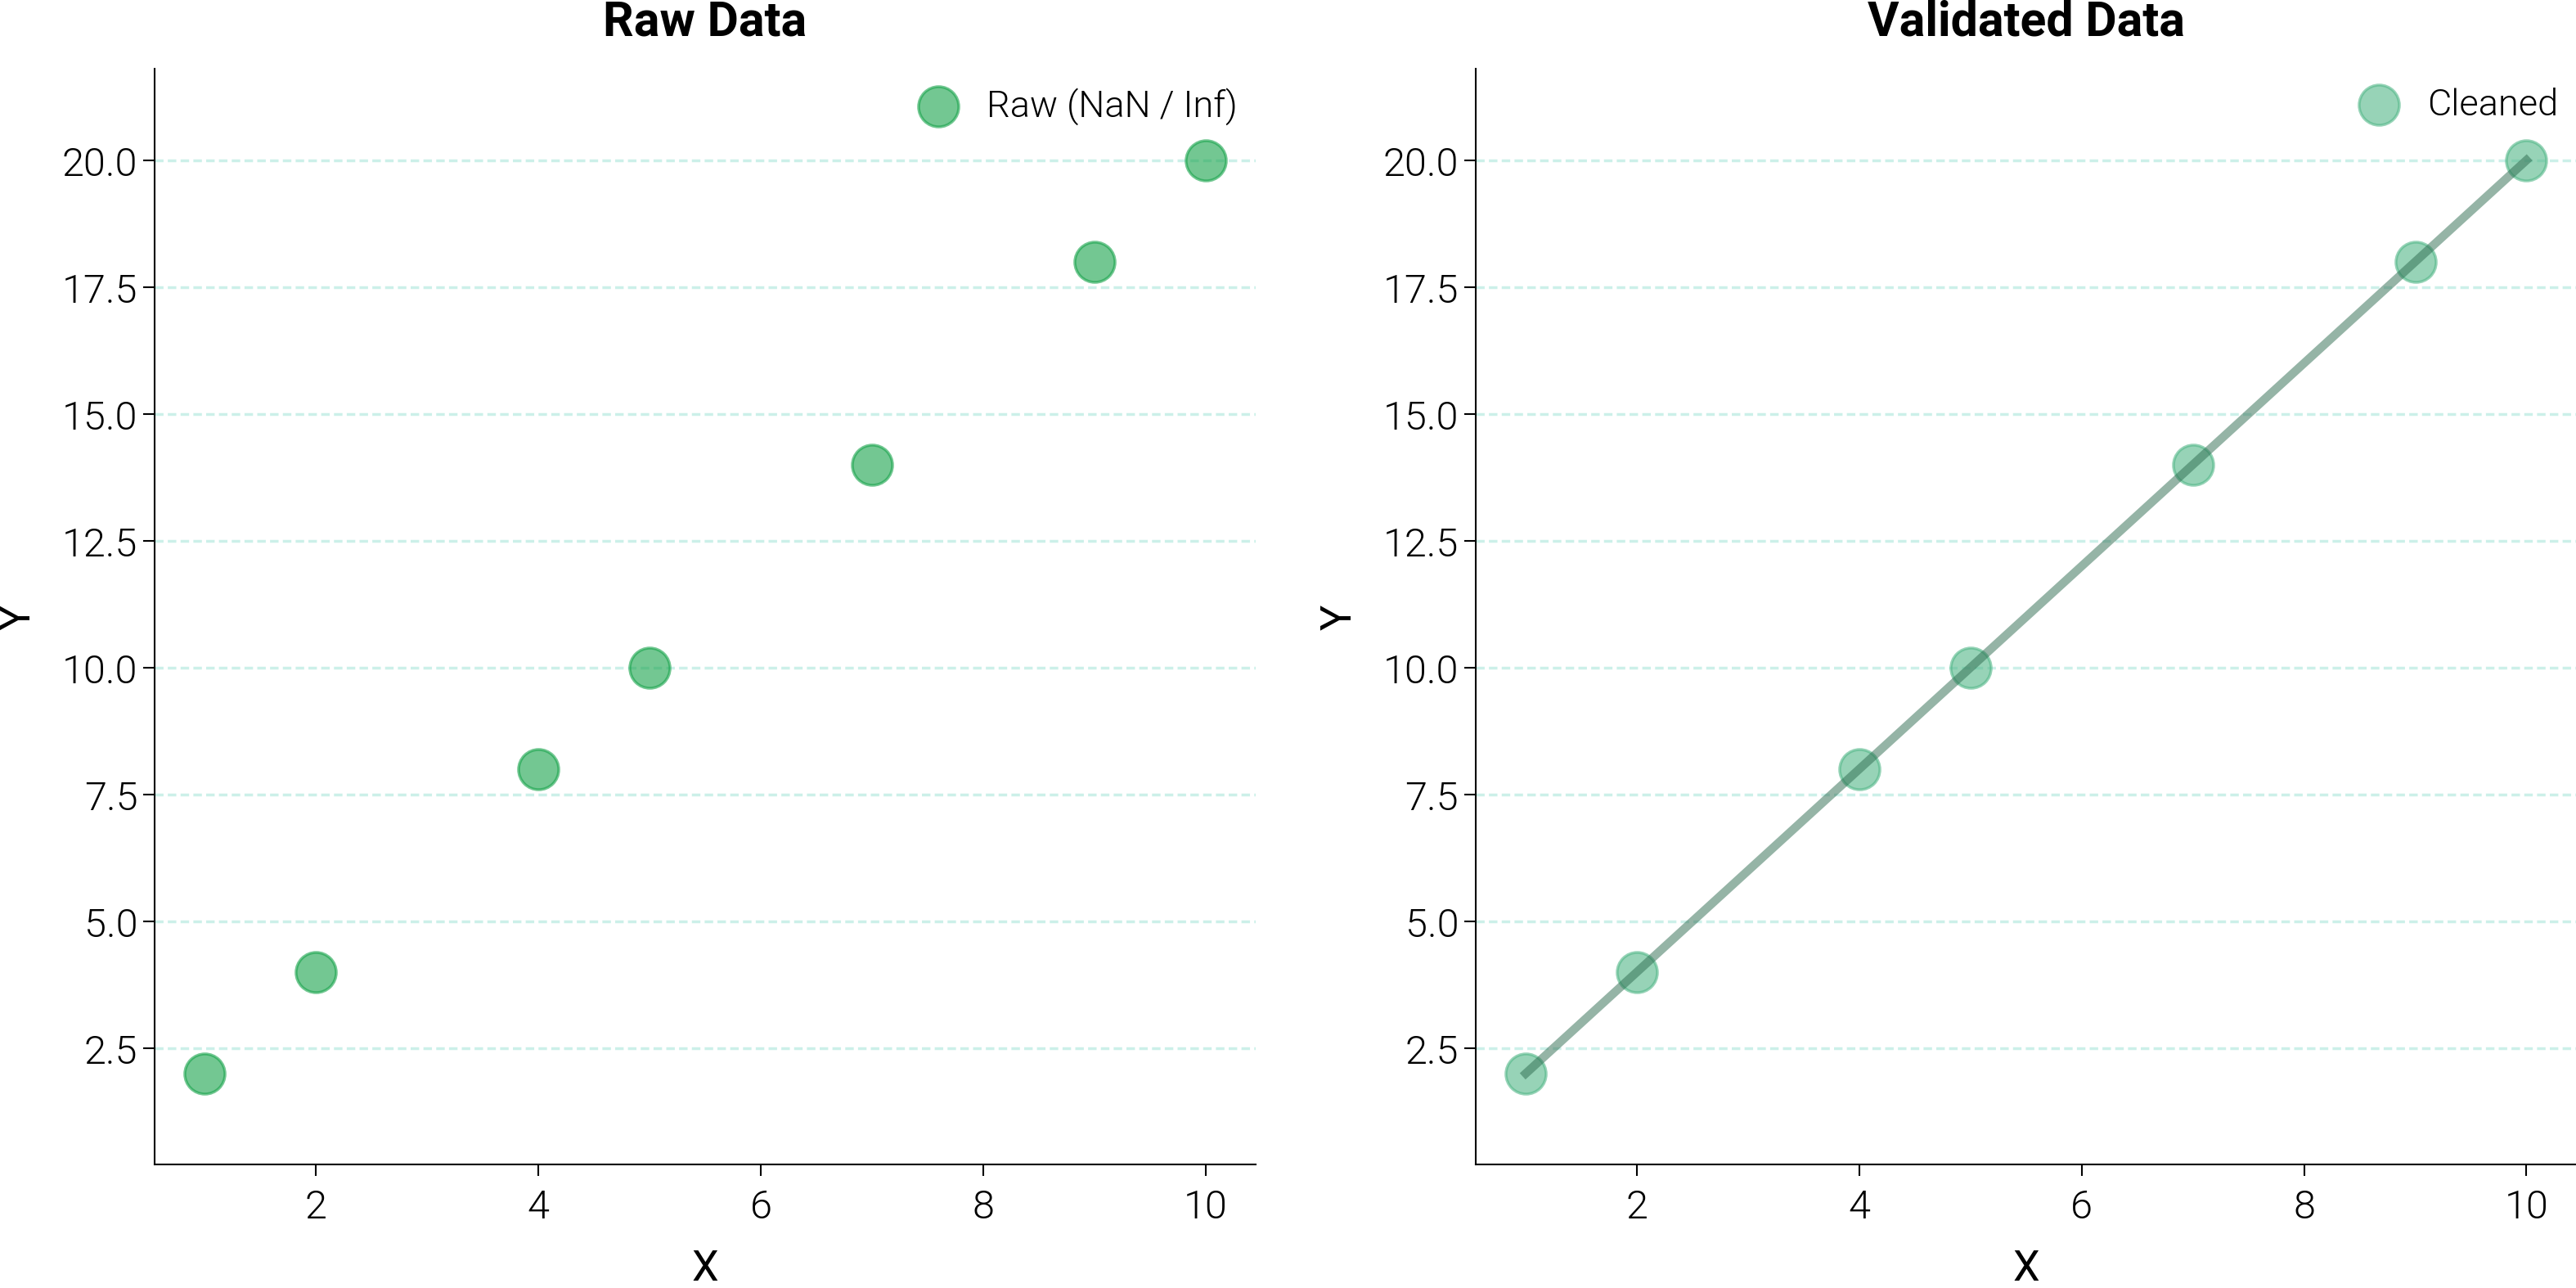
helpers.data — Data Validation
dm.helpers.data.validate_data strips NaN / Inf values from
paired arrays, enforces a same-length invariant, and can reject inputs
that drop below a minimum-points threshold. This example contrasts the
raw noisy input against the cleaned output side by side.
/home/runner/work/dartwork-mpl/dartwork-mpl/docs/examples_source/05_helpers_api/plot_helpers_data_validation.py:39: UserWarning: Removed 2 NaN/Inf values from data
  x_clean, y_clean = dm.helpers.data.validate_data(
/home/runner/work/dartwork-mpl/dartwork-mpl/docs/examples_source/05_helpers_api/plot_helpers_data_validation.py:39: UserWarning: Removed 1 NaN/Inf values from data
  x_clean, y_clean = dm.helpers.data.validate_data(
import matplotlib.pyplot as plt
import numpy as np

import dartwork_mpl as dm


def _minimal(ax: plt.Axes) -> None:
    """Inline minimal-axes recipe (top/right hidden + light dashed y-grid)."""
    ax.spines["top"].set_visible(False)
    ax.spines["right"].set_visible(False)
    ax.grid(
        True,
        axis="y",
        alpha=0.2,
        color="dc.indigo1",
        linestyle="--",
        linewidth=0.5,
    )
    ax.set_axisbelow(True)


np.random.seed(42)

# Raw data with NaN / Inf contamination.
x_raw = np.array([1, 2, np.nan, 4, 5, np.inf, 7, 8, 9, 10])
y_raw = np.array([2, 4, 6, 8, 10, 12, 14, np.nan, 18, 20])

# Validate and clean the pair.
x_clean, y_clean = dm.helpers.data.validate_data(
    x_raw, y_raw, require_same_length=True, allow_nan=False, min_points=3
)

dm.style.use("scientific")
fig, (ax1, ax2) = plt.subplots(1, 2, figsize=dm.figsize("16cm", "cinema"))

# Raw input, including the bad values.
ax1.scatter(
    x_raw, y_raw, color="dc.red2", s=50, alpha=0.6, label="Raw (NaN / Inf)"
)
ax1.set_title("Raw Data", fontsize=dm.fs(1))
ax1.set_xlabel("X", fontsize=dm.fs(0))
ax1.set_ylabel("Y", fontsize=dm.fs(0))
ax1.legend(fontsize=dm.fs(-1))
_minimal(ax1)

# Cleaned input.
ax2.scatter(
    x_clean, y_clean, color="dc.green2", s=50, alpha=0.6, label="Cleaned"
)
ax2.plot(x_clean, y_clean, color="dc.green4", lw=dm.lw(0.5), alpha=0.5)
ax2.set_title("Validated Data", fontsize=dm.fs(1))
ax2.set_xlabel("X", fontsize=dm.fs(0))
ax2.set_ylabel("Y", fontsize=dm.fs(0))
ax2.legend(fontsize=dm.fs(-1))
_minimal(ax2)

dm.simple_layout(fig)
plt.show()
Total running time of the script: (0 minutes 0.571 seconds)