Note
Go to the end to download the full example code.
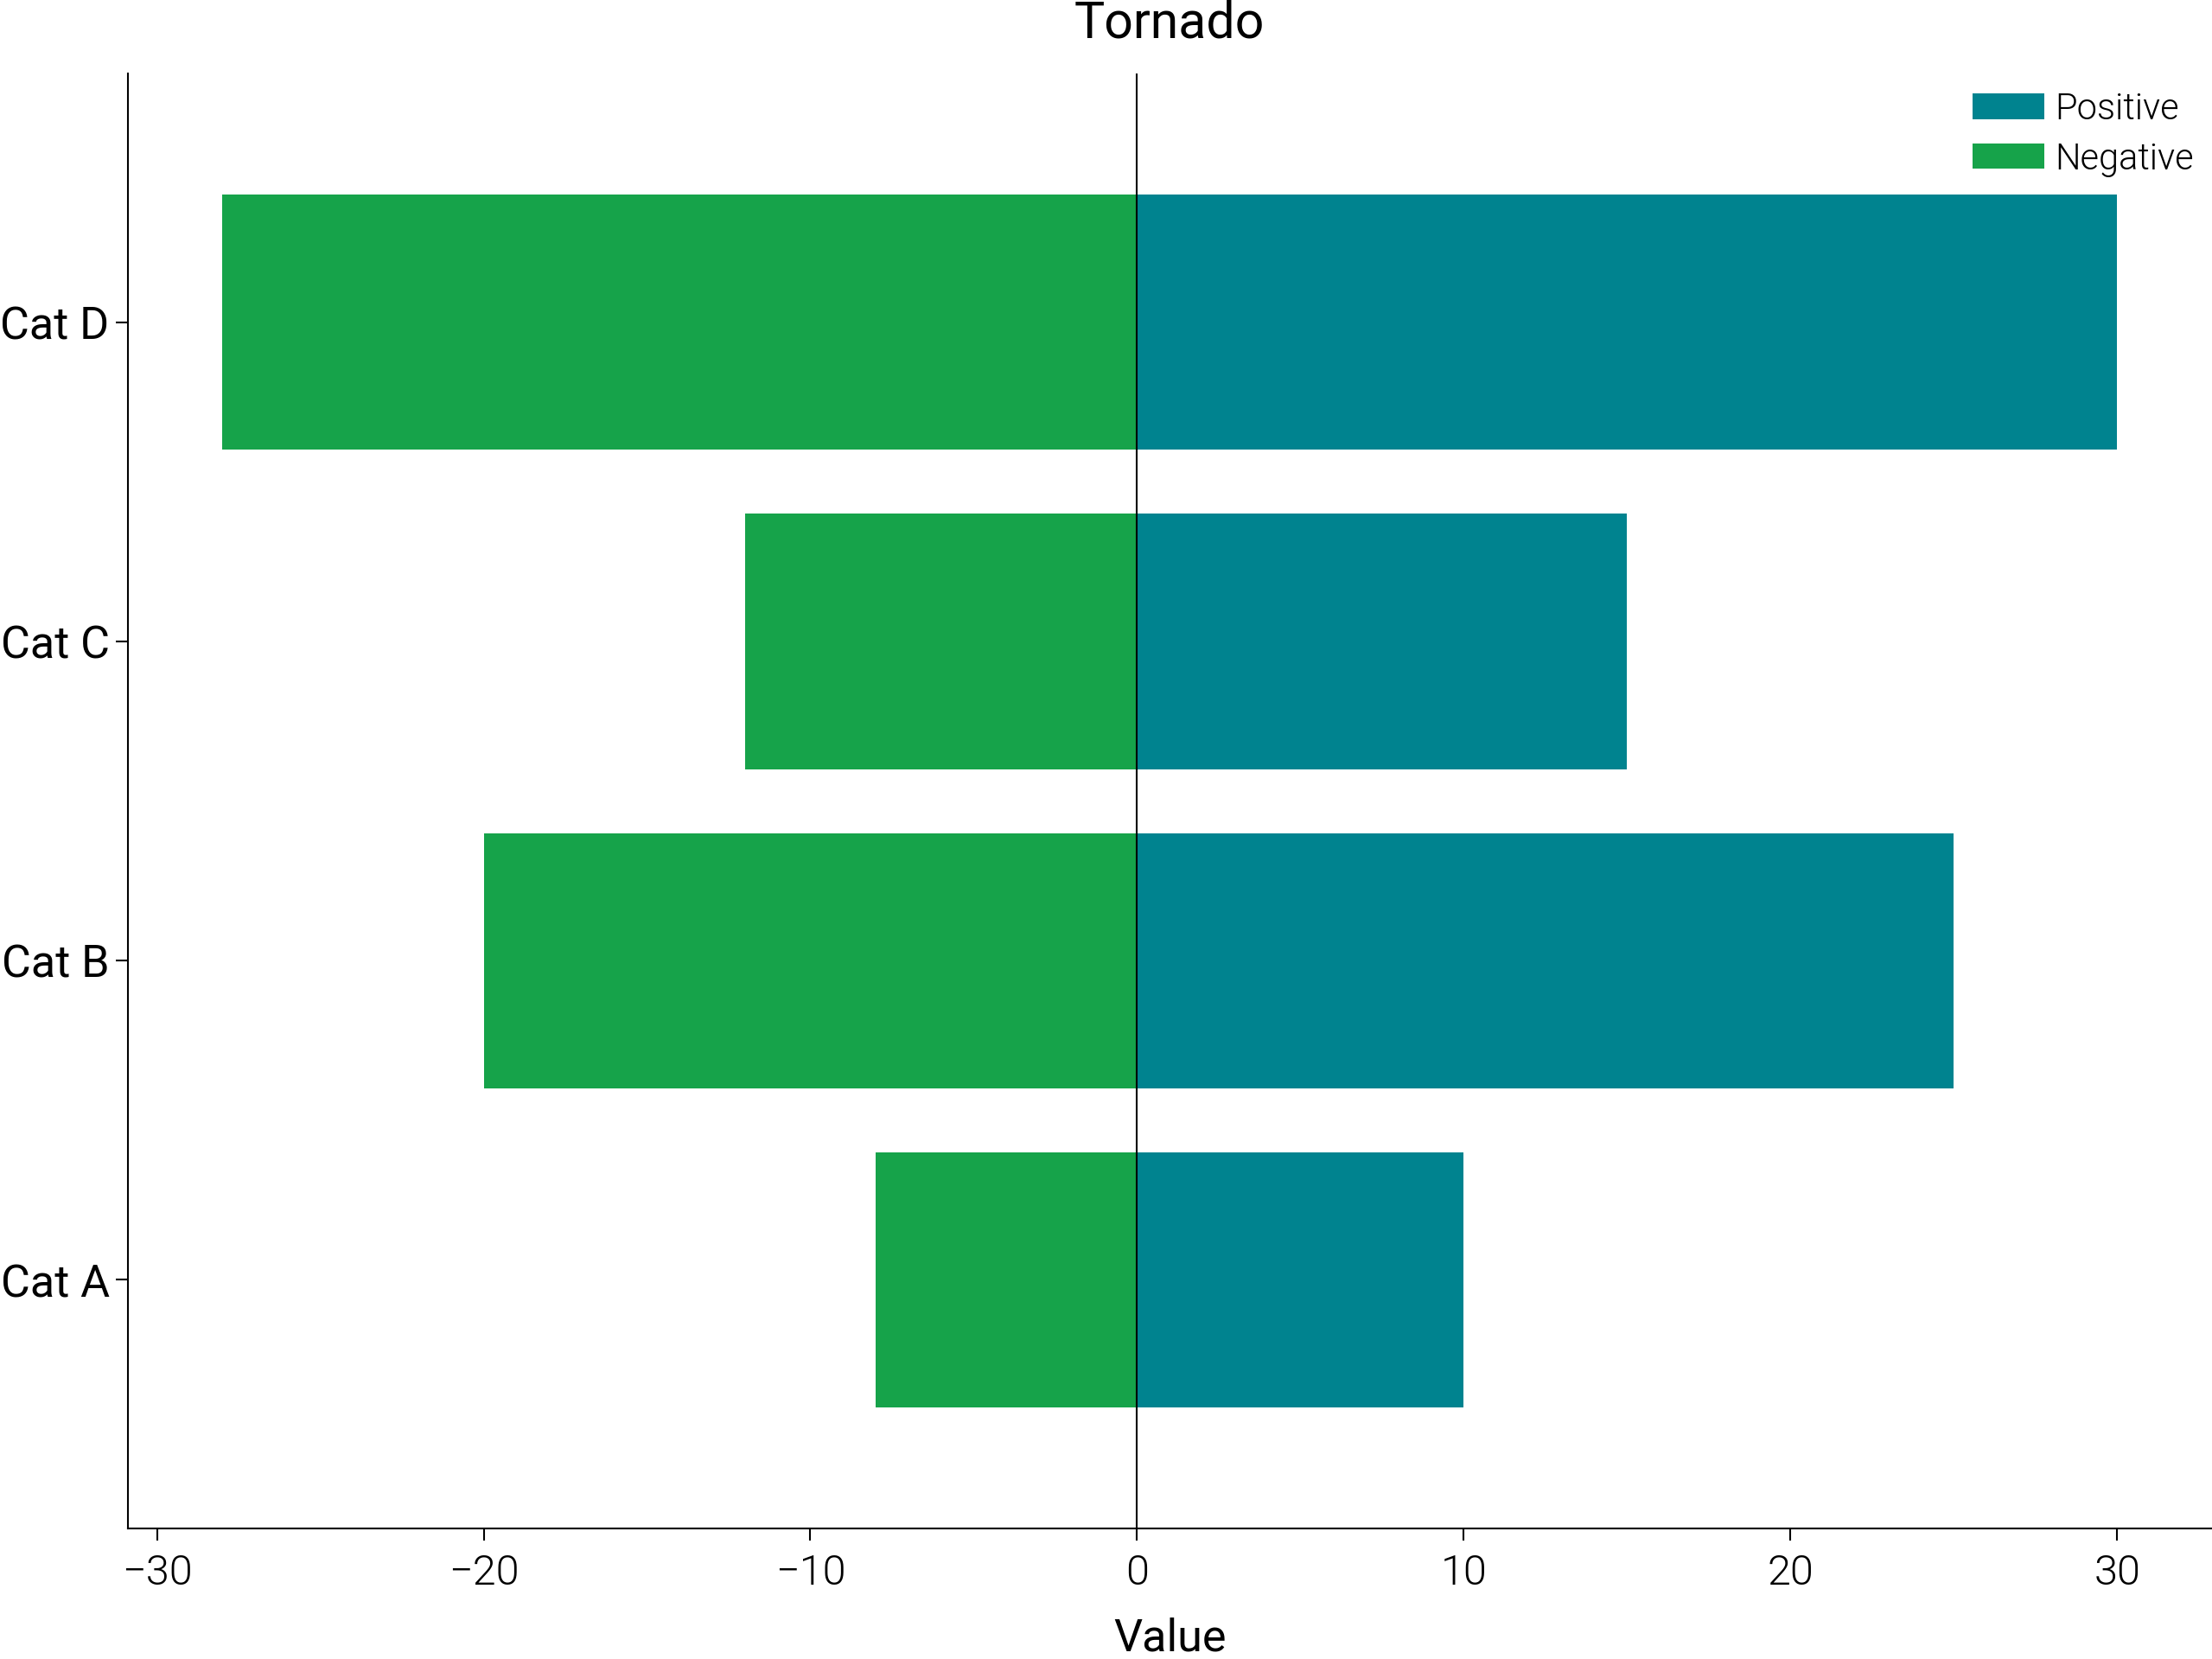
Tornado
Tornado chart - symmetric horizontal bars.
Source: dartwork_mpl/asset/prompt/05-templates/tornado.py ·
dm.get_prompt("05-templates/tornado") · MCP
dartwork-mpl://templates/tornado.
# ai-template-meta-start
# use_case: Show signed deviations from a baseline (sensitivity)
# difficulty: intermediate
# data_shape: labels: list[str], lows: list[float], highs: list[float]
# tags: tornado, sensitivity, deviation, horizontal
# ai-template-meta-end

import matplotlib.pyplot as plt
import numpy as np

import dartwork_mpl as dm

dm.style.use("scientific")

categories = ["Cat A", "Cat B", "Cat C", "Cat D"]
positive = [10, 25, 15, 30]
negative = [-8, -20, -12, -28]

fig, ax = plt.subplots(figsize=dm.figsize("13cm", "standard"))
y_pos = np.arange(len(categories))
ax.barh(y_pos, positive, color="dc.teal2", label="Positive")
ax.barh(y_pos, negative, color="dc.red2", label="Negative")
ax.set_yticks(y_pos)
ax.set_yticklabels(categories)
ax.axvline(0, color="black", linewidth=0.3)
ax.set_xlabel("Value")
ax.legend()
ax.set_title("Tornado", fontsize=dm.fs(1), fontweight=dm.fw(1))

dm.simple_layout(fig)
Total running time of the script: (0 minutes 0.331 seconds)