Note
Go to the end to download the full example code.
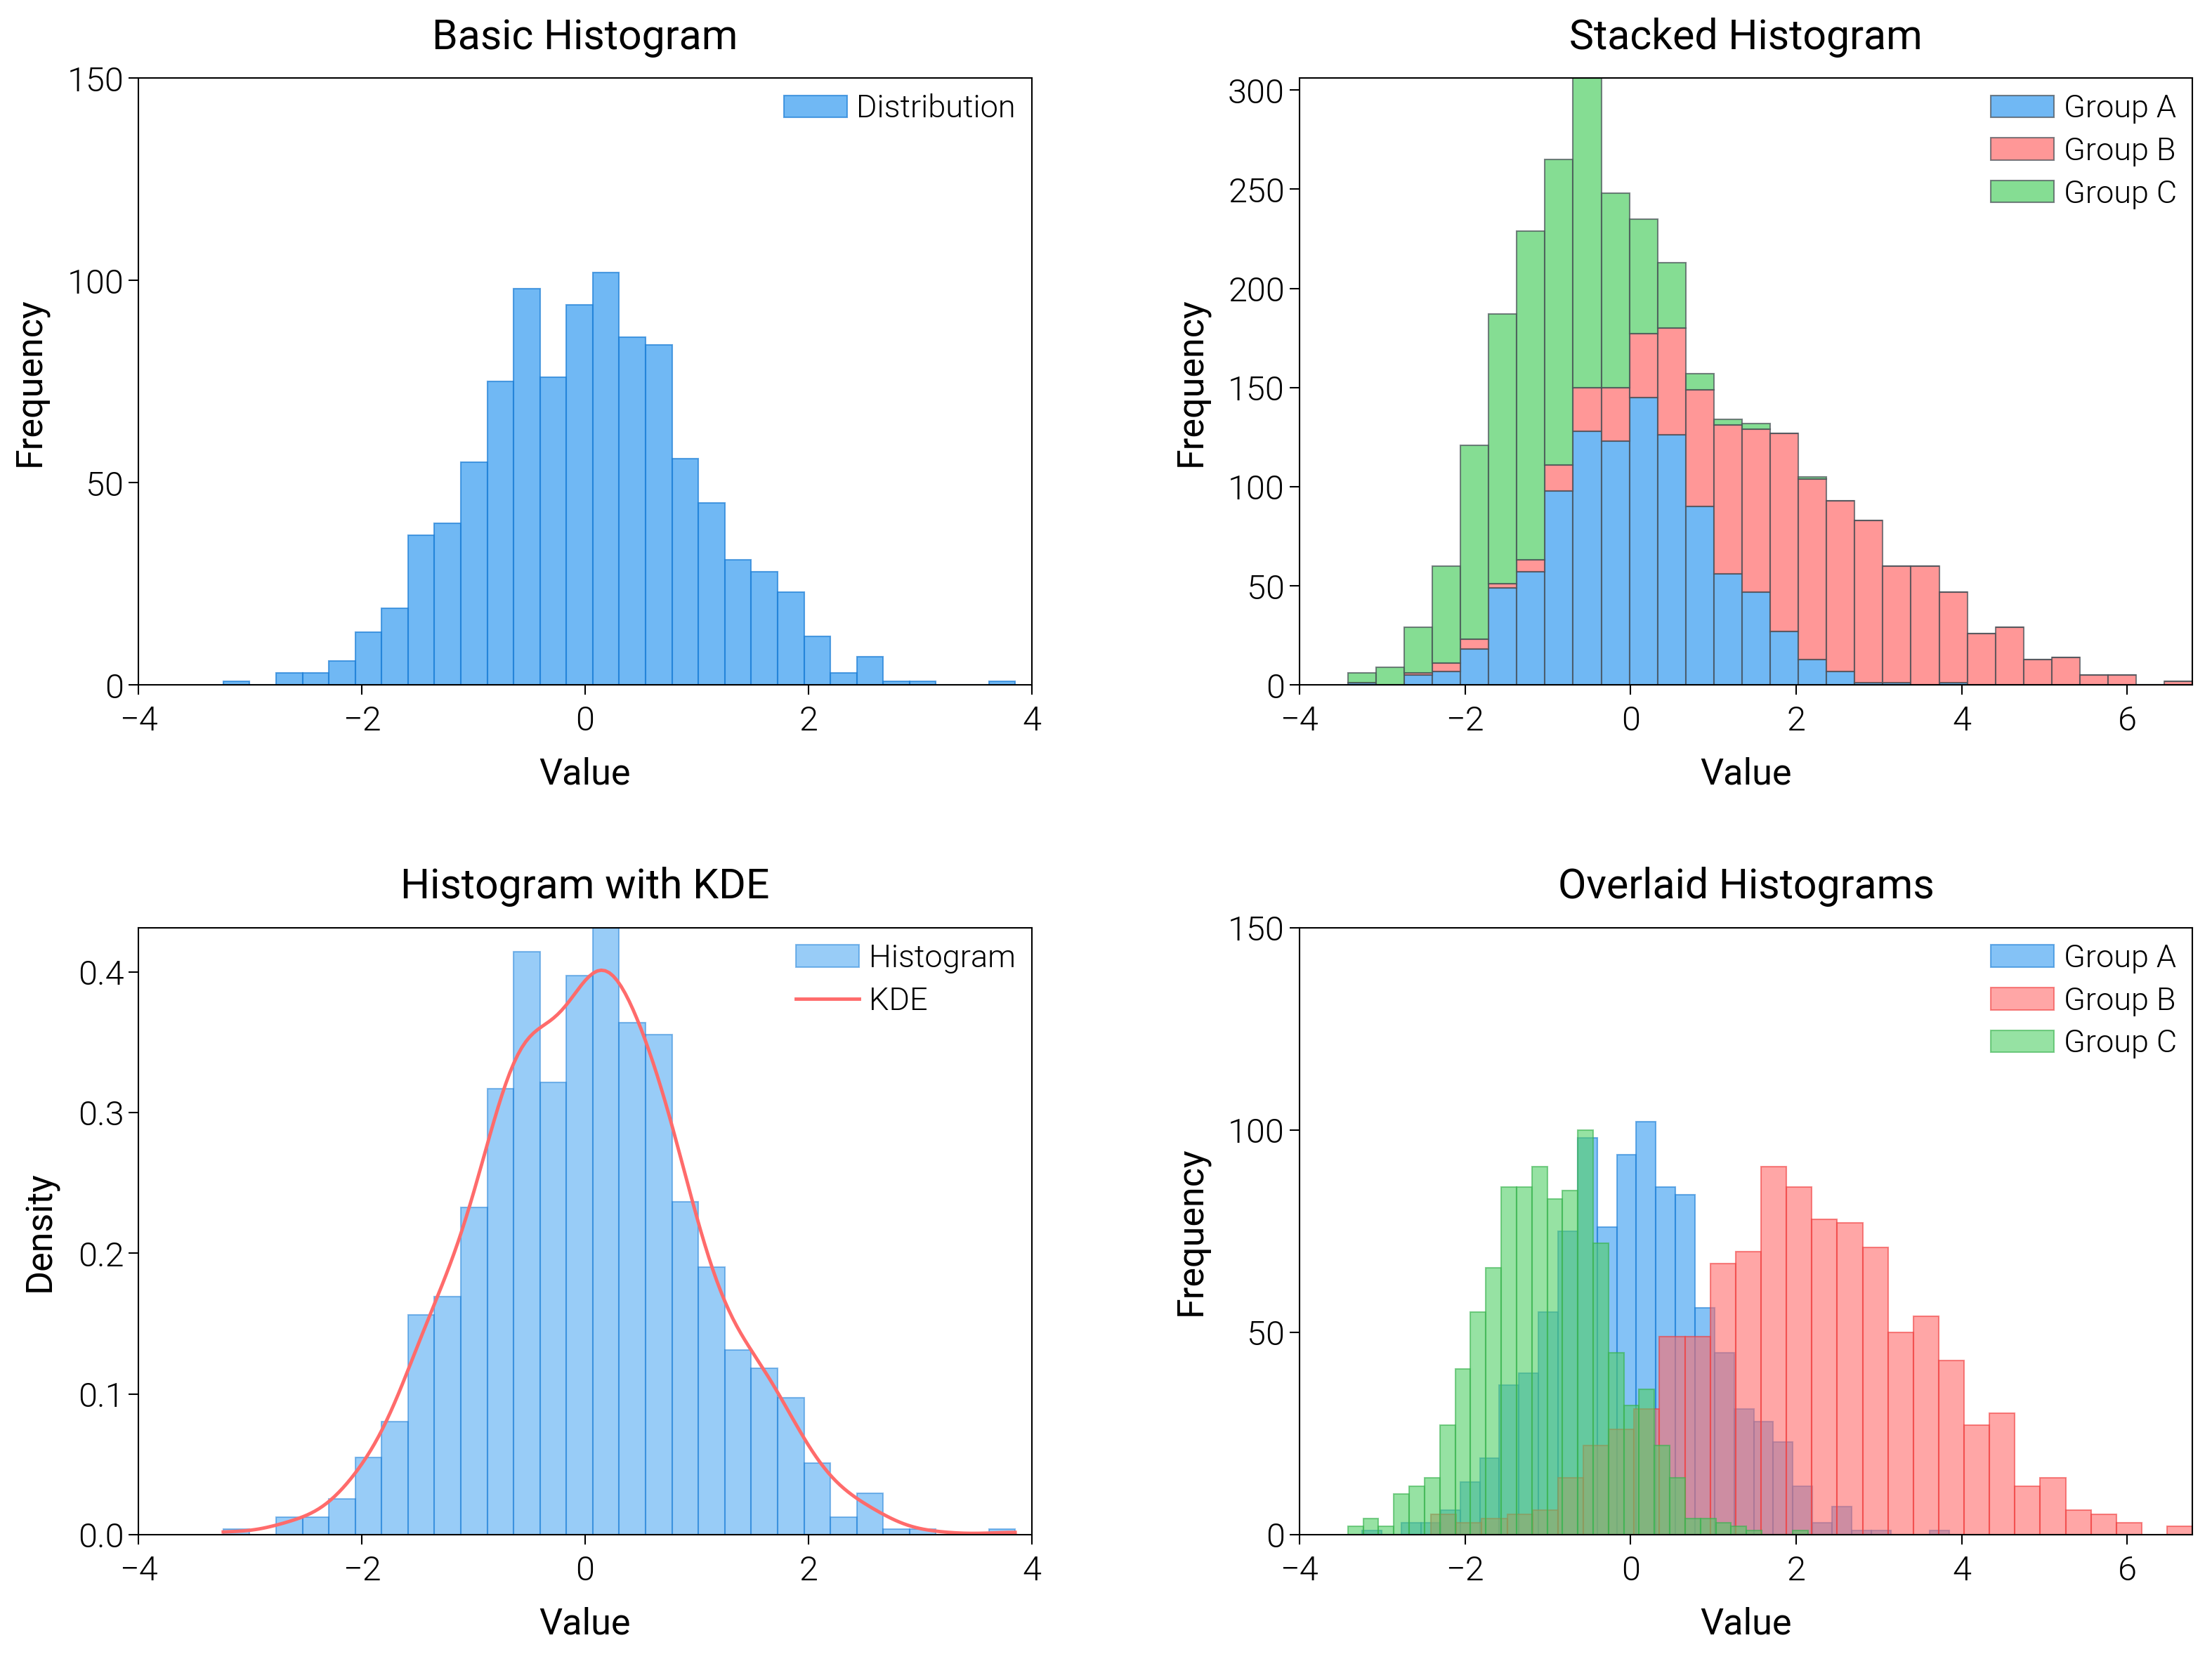
Histogram
Histogram of standard normal samples.
Source: dartwork_mpl/asset/prompt/05-templates/histogram.py ·
dm.get_prompt("05-templates/histogram") · MCP
dartwork-mpl://templates/histogram.
# ai-template-meta-start
# use_case: Show the distribution of a single numeric sample
# difficulty: beginner
# data_shape: values: list[float]
# tags: distribution, histogram, frequency
# ai-template-meta-end

import matplotlib.pyplot as plt
import numpy as np

import dartwork_mpl as dm

dm.style.use("scientific")

rng = np.random.default_rng(42)
data = rng.standard_normal(1000)

fig, ax = plt.subplots(figsize=dm.figsize("13cm", "standard"))
ax.hist(data, bins=30, color="dc.teal2", edgecolor="white", linewidth=0.3)
ax.set_xlabel("Value")
ax.set_ylabel("Frequency")
ax.set_title("Standard normal", fontsize=dm.fs(1), fontweight=dm.fw(1))

dm.simple_layout(fig)
Total running time of the script: (0 minutes 0.376 seconds)