Note
Go to the end to download the full example code.
DNA Double Helix
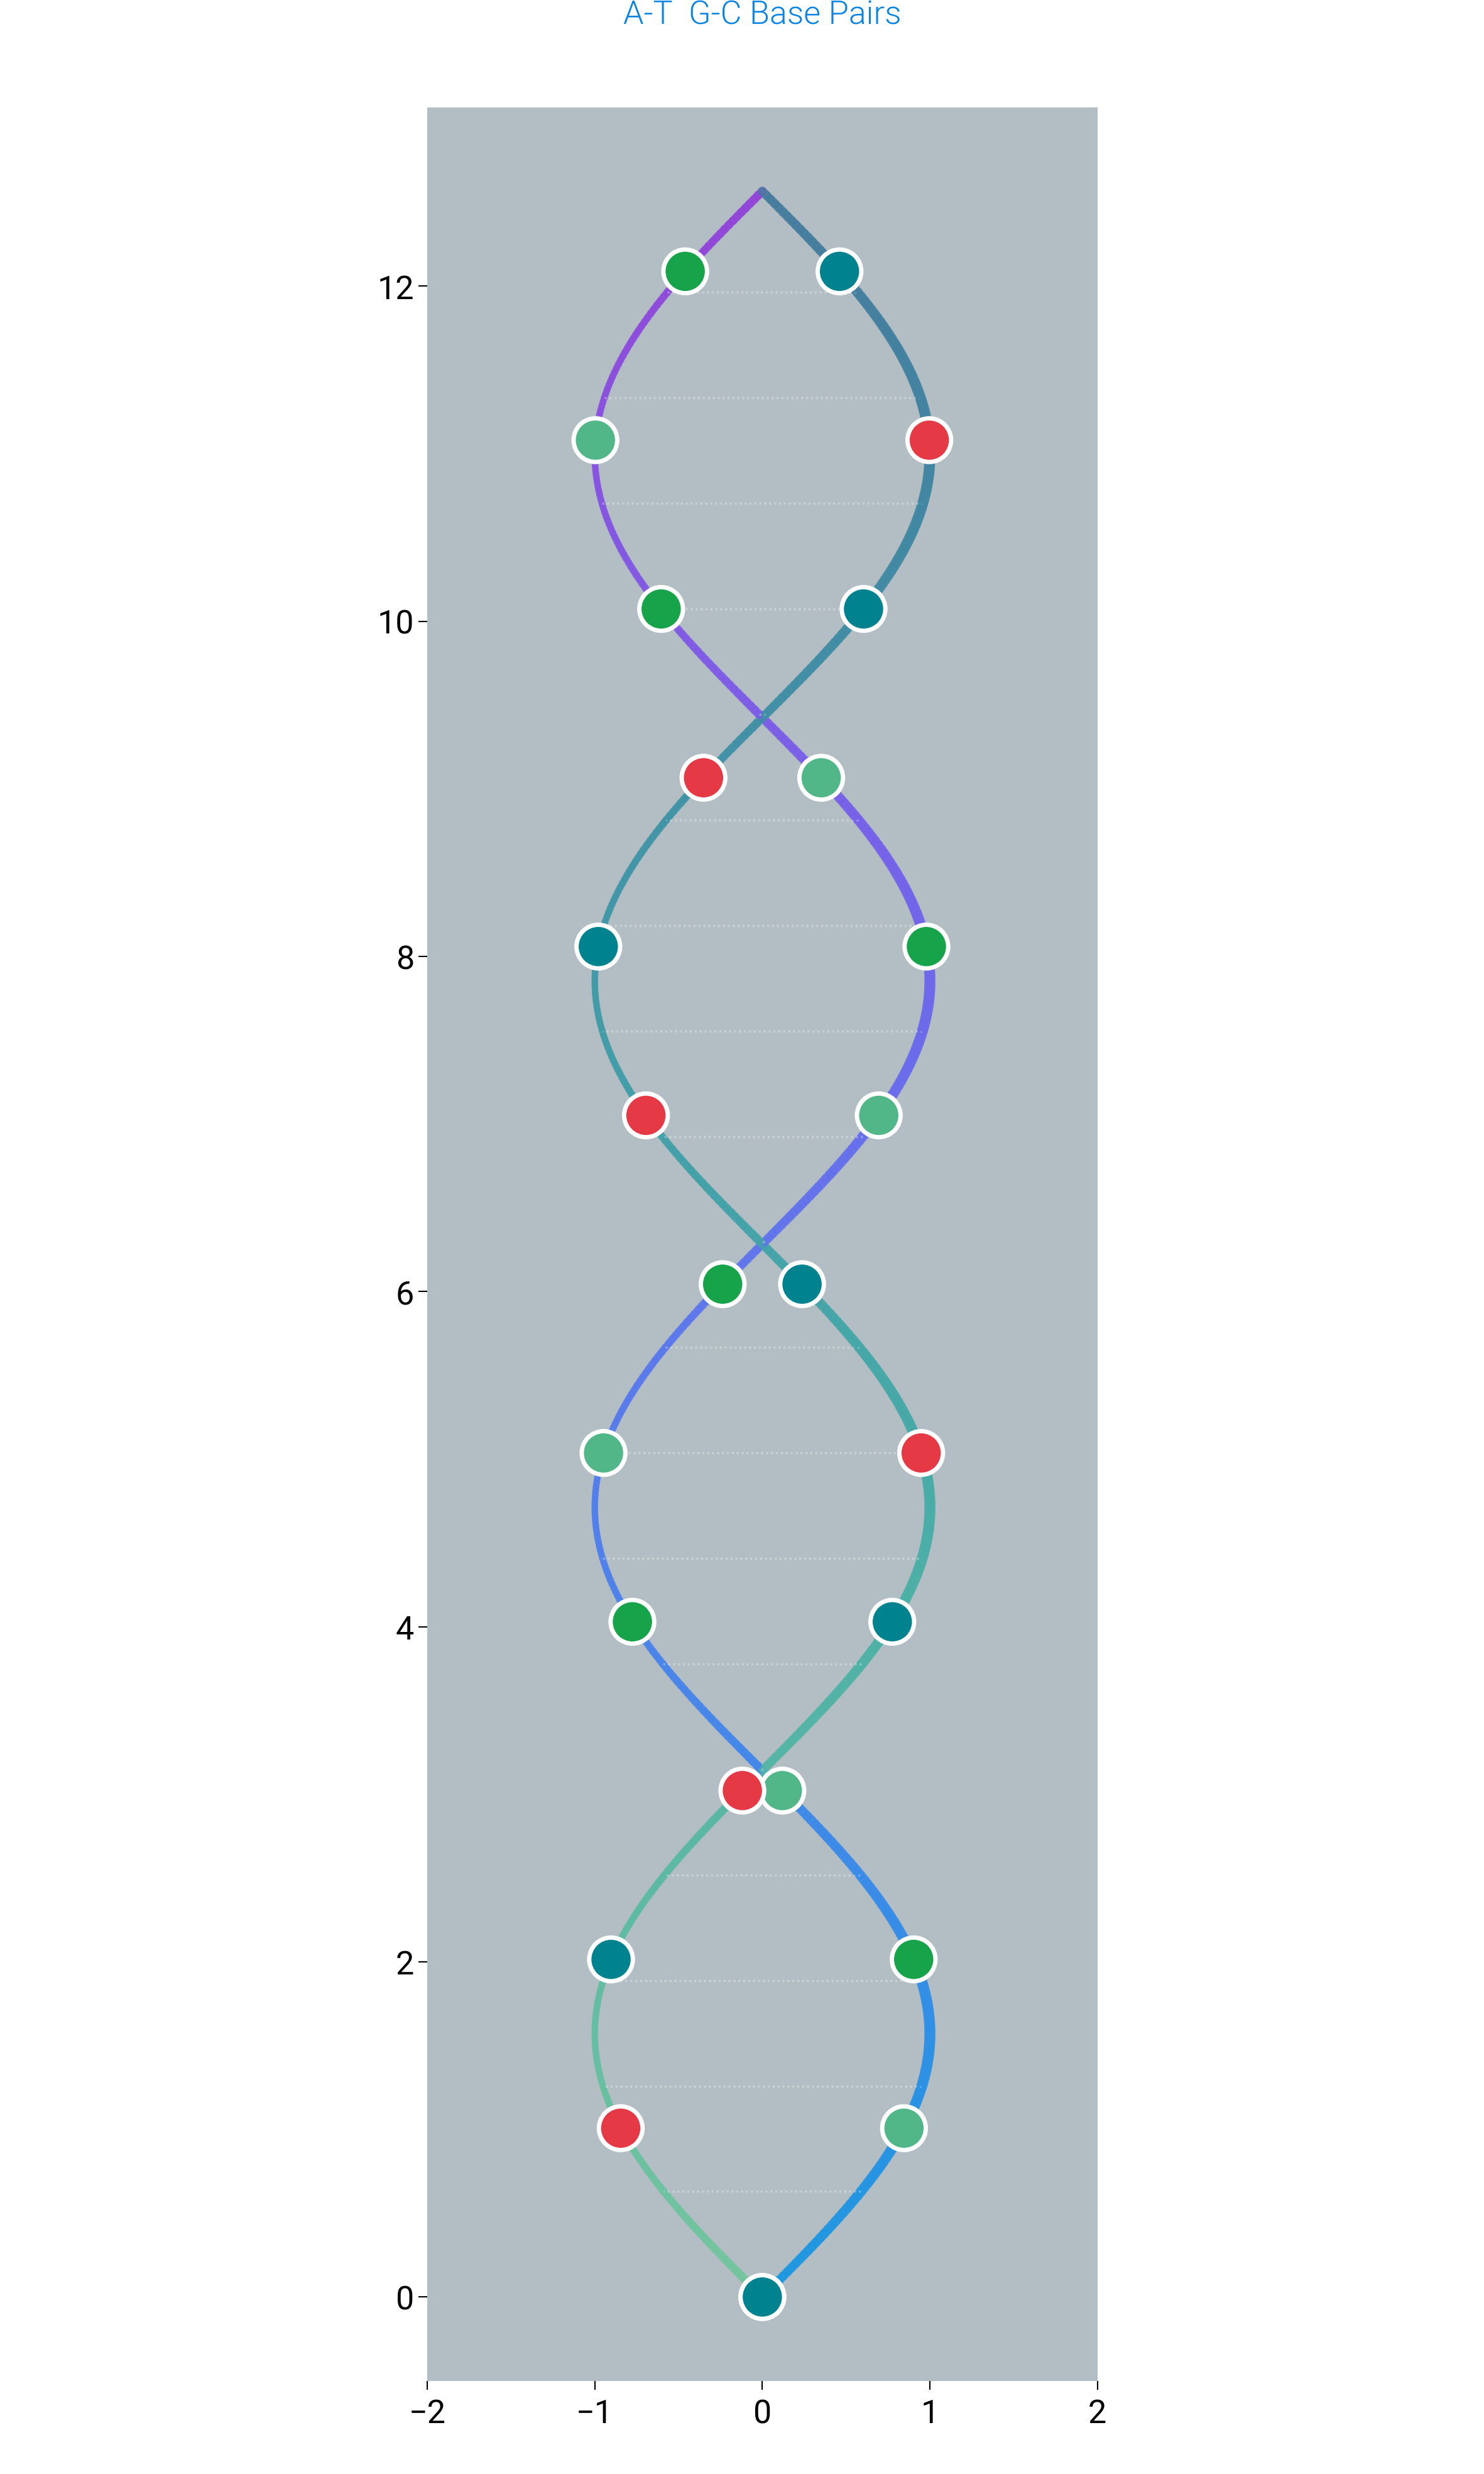
A 2D representation of a double helix, with each strand drawn segment by segment so that line width modulates with the helical phase. The illusion of depth comes purely from those width changes — no 3D axes needed.
Two dm.cspace ramps colour the strands (blue→purple, green→orange),
and base pairs are dropped at fixed intervals as coloured scatter
points.
import matplotlib.pyplot as plt
import numpy as np

import dartwork_mpl as dm

np.random.seed(42)
dm.style.use("scientific")

fig, ax = plt.subplots(figsize=dm.figsize("12cm", 1.667))

t = np.linspace(0, 4 * np.pi, 500)
x1 = np.sin(t)
x2 = np.sin(t + np.pi)
y = t

colors_helix1 = dm.cspace("dc.teal1", "oc.purple7", n=len(t))
colors_helix2 = dm.cspace("dc.green1", "dc.orange3", n=len(t))

for i in range(len(t) - 1):
    width1 = 2 + np.sin(t[i]) * 0.5
    ax.plot(
        [x1[i], x1[i + 1]],
        [y[i], y[i + 1]],
        color=colors_helix1[i].to_hex(),
        linewidth=width1,
        alpha=0.8,
        solid_capstyle="round",
    )

    width2 = 2 - np.sin(t[i]) * 0.5
    ax.plot(
        [x2[i], x2[i + 1]],
        [y[i], y[i + 1]],
        color=colors_helix2[i].to_hex(),
        linewidth=width2,
        alpha=0.8,
        solid_capstyle="round",
    )

    if i % 25 == 0:
        ax.plot(
            [x1[i], x2[i]],
            [y[i], y[i]],
            color="white",
            alpha=0.3,
            lw=0.5,
            linestyle=":",
        )

for i in range(0, len(t), 40):
    if i % 80 == 0:
        ax.scatter(
            [x1[i], x2[i]],
            [y[i], y[i]],
            c=["dc.red2", "dc.teal2"],
            s=100,
            edgecolors="white",
            linewidths=1,
            zorder=5,
        )
    else:
        ax.scatter(
            [x1[i], x2[i]],
            [y[i], y[i]],
            c=["dc.green2", "dc.orange2"],
            s=100,
            edgecolors="white",
            linewidths=1,
            zorder=5,
        )

for s in ax.spines.values():
    s.set_visible(False)
ax.set_xlim(-2, 2)
ax.set_ylim(-0.5, 4 * np.pi + 0.5)
ax.set_aspect("equal")
ax.set_facecolor("dc.indigo0")

ax.text(
    0,
    -1,
    "DNA Double Helix",
    ha="center",
    fontsize=dm.fs(3),
    color="white",
    weight="bold",
)
ax.text(
    0,
    4 * np.pi + 1,
    "A-T  G-C Base Pairs",
    ha="center",
    fontsize=dm.fs(0),
    color="dc.indigo2",
)

dm.simple_layout(fig)
plt.show()
Total running time of the script: (0 minutes 1.367 seconds)