Note
Go to the end to download the full example code.
Waterfall (Advanced)
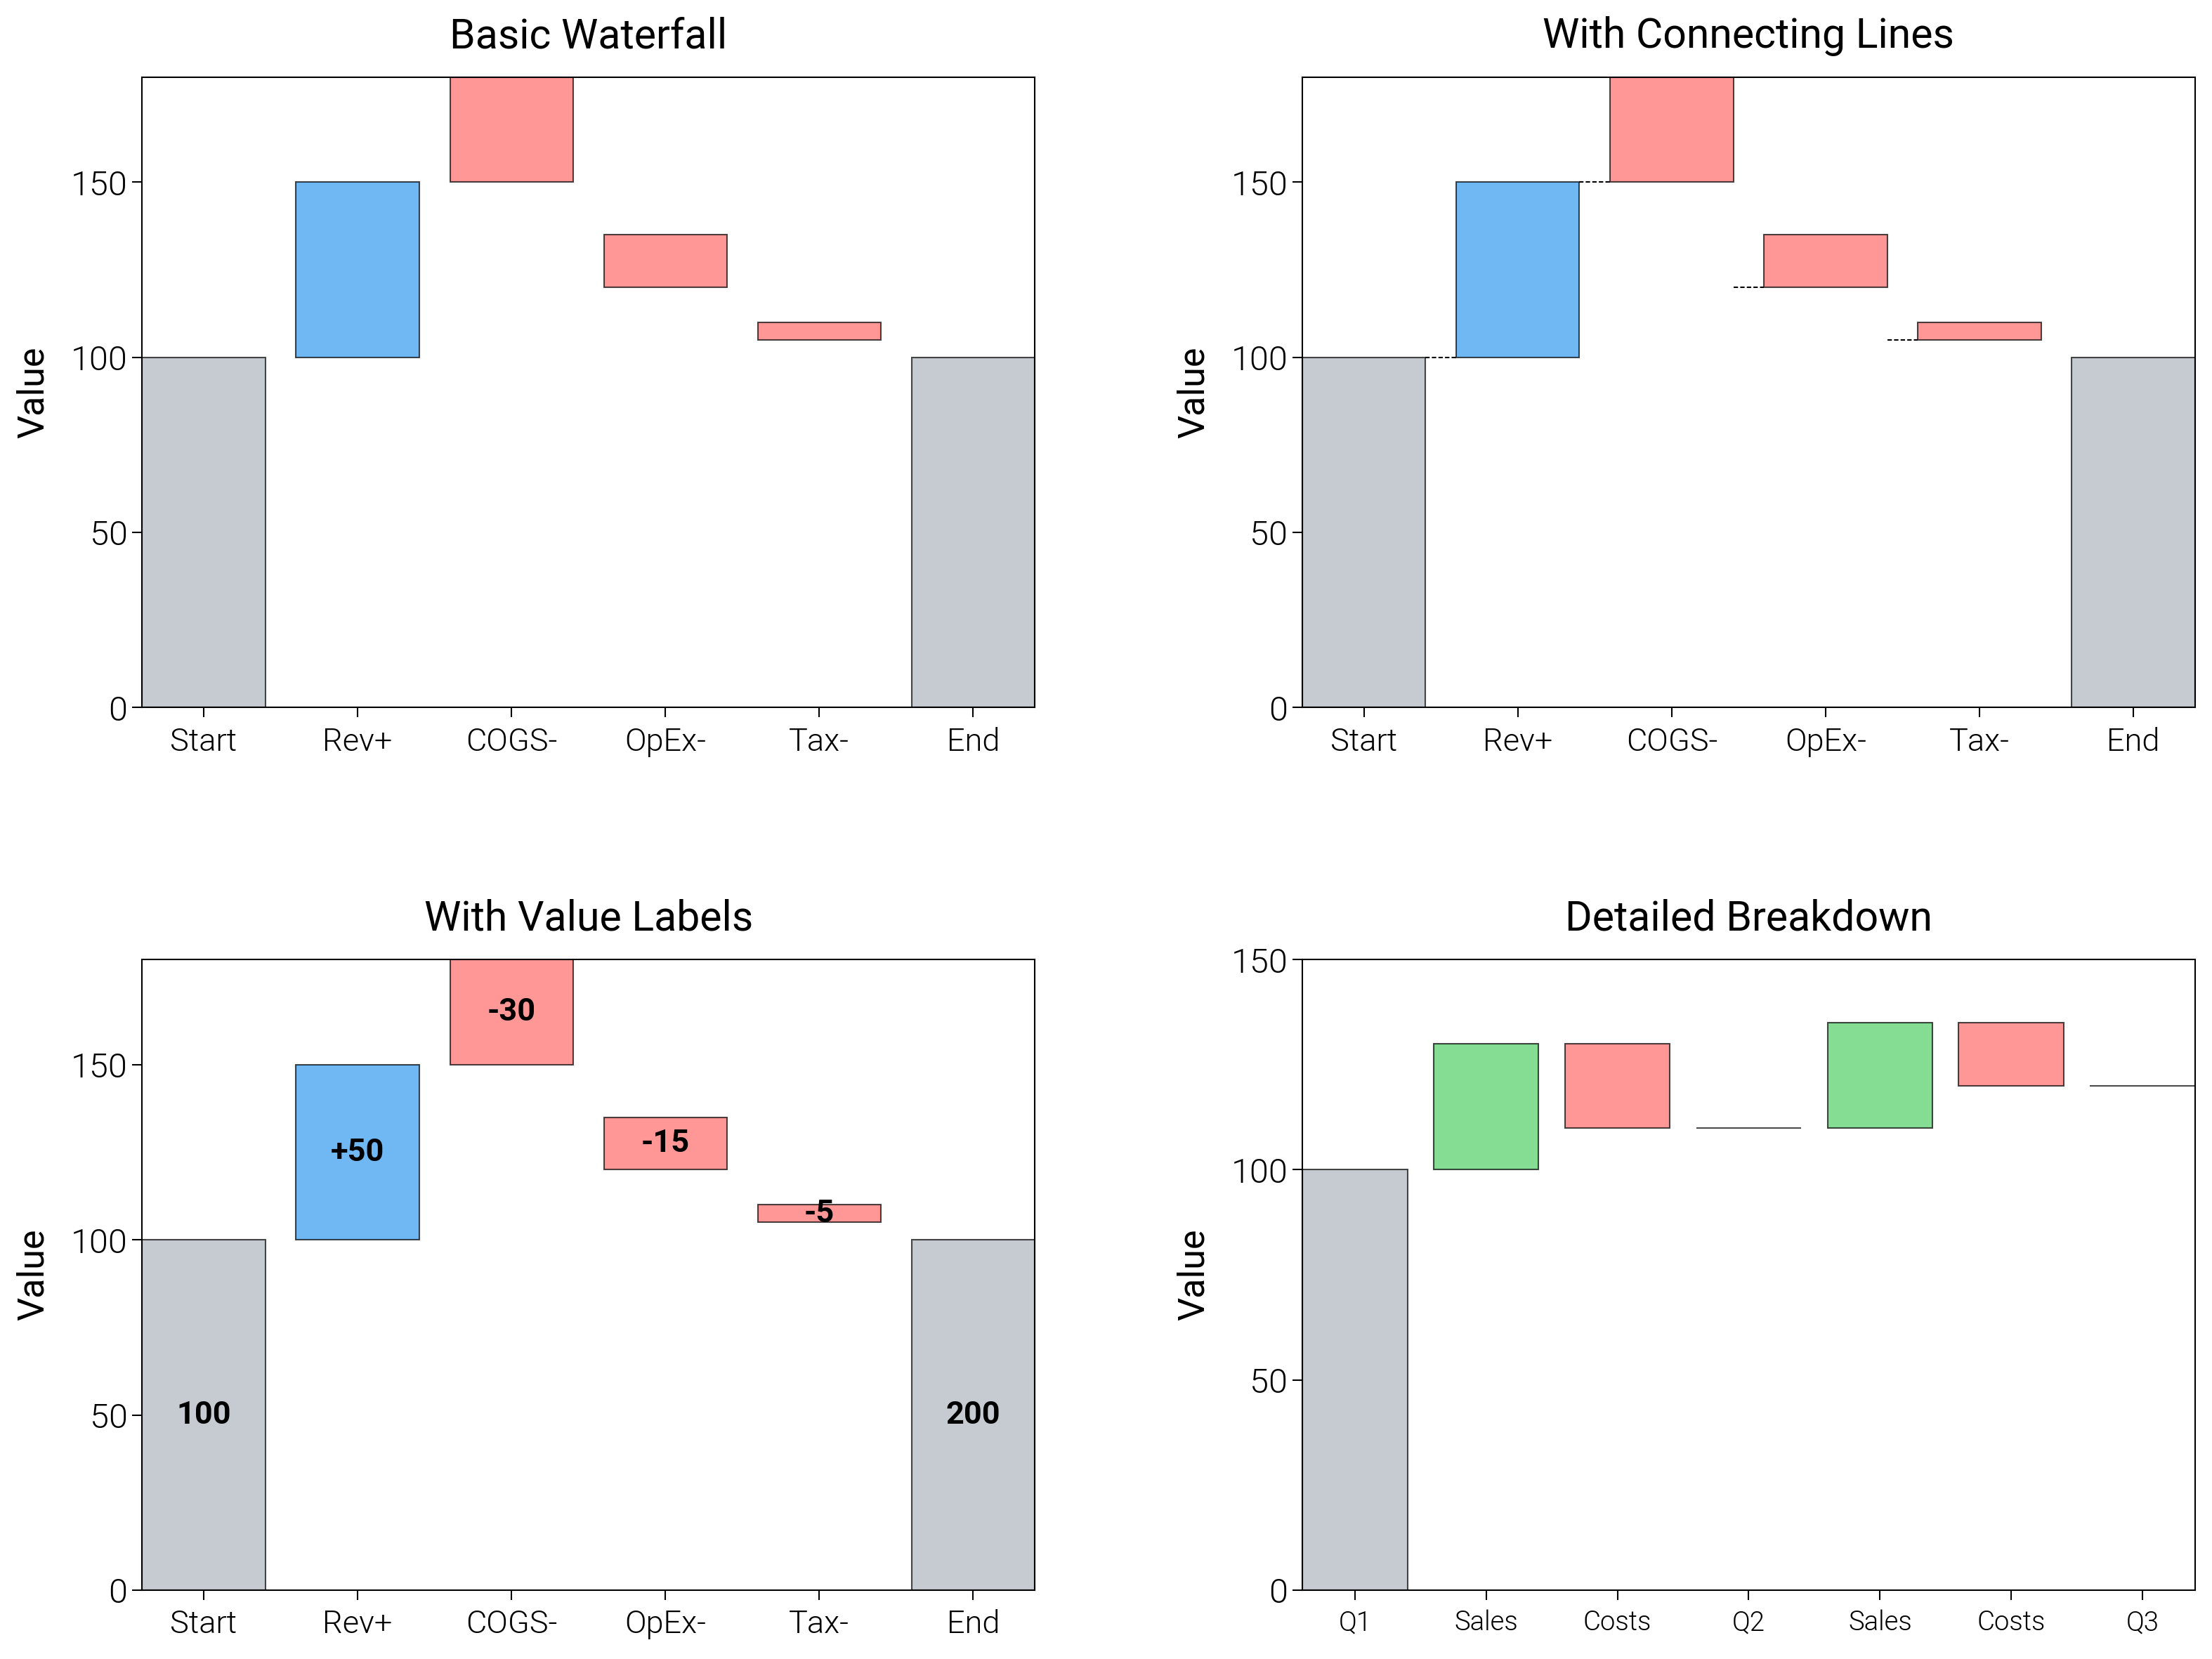
Waterfall — advanced template (cumulative bridge with connectors).
Source: dartwork_mpl/asset/prompt/05-templates/advanced/waterfall.py ·
MCP dartwork-mpl://template/advanced/waterfall.
[VISUAL] ⚠️  TEXT_CONTRAST: Text contrast 1.92:1 is below the 4.5:1 AA threshold for normal text across 5 text items (sample: '-280')
[VISUAL] 💡 TEXT_CONTRAST: Text contrast 3.32:1 is below the 4.5:1 AA threshold for normal text (sample: 'Synthetic bridge; dashed connectors t...')
[VISUAL] ⚠️  TEXT_CONTRAST: Text contrast 2.07:1 is below the 4.5:1 AA threshold for normal text (sample: 'Source: synthetic energy-bridge model.')
[VISUAL] 💡 GRAYSCALE_SAFETY: The project modeled-relative-Y proximity heuristic before compositing found source-RGB pairs below its ΔY threshold; inspect ΔEOK separation: #adb5bd/#ffa926

=== FIX SUGGESTIONS ===
[waterfall-advanced] quality issues: ['Axes 0: Missing x-axis label']
[VISUAL] ⚠️  TEXT_CONTRAST: Text contrast 1.92:1 is below the 4.5:1 AA threshold for normal text across 5 text items (sample: '-280')
[VISUAL] 💡 TEXT_CONTRAST: Text contrast 3.32:1 is below the 4.5:1 AA threshold for normal text (sample: 'Synthetic bridge; dashed connectors t...')
[VISUAL] ⚠️  TEXT_CONTRAST: Text contrast 2.07:1 is below the 4.5:1 AA threshold for normal text (sample: 'Source: synthetic energy-bridge model.')
[VISUAL] 💡 GRAYSCALE_SAFETY: The project modeled-relative-Y proximity heuristic before compositing found source-RGB pairs below its ΔY threshold; inspect ΔEOK separation: #adb5bd/#ffa926
# ai-template-meta-start
# tier: advanced
# basic_counterpart: waterfall
# use_case: Cumulative bridge from one total to another via signed components, with connector lines
# difficulty: advanced
# data_shape: labels: list[str], values: list[float], is_total: list[bool]
# tags: waterfall, bridge, cumulative, annotated, narrative
# narrative: Energy bridge from generation to net delivery; positives green, negatives red, totals gray
# advanced_apis: cumulative bottom calc, sign-color, dashed connector lines between bar tops, value labels, format_axis_si
# ai-template-meta-end

import matplotlib.patches as mpatches
import matplotlib.pyplot as plt
import numpy as np

import dartwork_mpl as dm

dm.style.use("scientific")

# (label, delta_value, is_total)
# Totals sit at fixed positions; deltas accumulate between them.
items = [
    ("Generated", 1200, True),
    ("Line loss", -280, False),
    ("Self-use", -240, False),
    ("Storage charge", -85, False),
    ("Net to grid", 595, True),
    ("Conversion", -45, False),
    ("Tariff", -110, False),
    ("Delivered", 440, True),
]
labels = [i[0] for i in items]
deltas = np.array([i[1] for i in items], dtype=float)
is_total = [i[2] for i in items]

# Compute bottoms / tops for the bars.
running = 0
bottoms = []
tops = []
heights = []
for d, total in zip(deltas, is_total, strict=False):
    if total:
        bottoms.append(0)
        heights.append(d)
        running = d
        tops.append(d)
    else:
        if d >= 0:
            bottoms.append(running)
            heights.append(d)
            tops.append(running + d)
            running += d
        else:
            bottoms.append(running + d)
            heights.append(-d)
            tops.append(running)
            running += d

pos_color = dm.color("dc.green5").to_hex()
neg_color = dm.color("dc.amber5").to_hex()
tot_color = dm.color("oc.gray6").to_hex()
colors = []
for d, total in zip(deltas, is_total, strict=False):
    if total:
        colors.append(tot_color)
    elif d >= 0:
        colors.append(pos_color)
    else:
        colors.append(neg_color)

fig, ax = plt.subplots(figsize=dm.figsize("15cm", "standard"))

xs = np.arange(len(items))
ax.bar(
    xs,
    heights,
    bottom=bottoms,
    color=colors,
    edgecolor="white",
    linewidth=0.3,
    width=0.7,
)

# Dashed connector lines from prev top to next bar.
for i in range(len(items) - 1):
    next_total = is_total[i + 1]
    prev_top = tops[i] if not is_total[i] else heights[i]
    if next_total:
        next_y = heights[i + 1]
    else:
        next_y = (
            bottoms[i + 1]
            if deltas[i + 1] >= 0
            else bottoms[i + 1] + heights[i + 1]
        )
    ax.plot(
        [xs[i] + 0.35, xs[i + 1] - 0.35],
        [prev_top, next_y],
        color="oc.gray5",
        linewidth=0.5,
        linestyle="--",
        zorder=1,
    )

# Per-bar value labels.
for i, (d, b, h, total) in enumerate(
    zip(deltas, bottoms, heights, is_total, strict=False)
):
    y = b + h + 18
    if total:
        ax.text(
            xs[i],
            y,
            f"{d:,.0f} MWh",
            ha="center",
            va="bottom",
            fontsize=dm.fs(-1),
            fontweight=dm.fw(1),
            color="oc.gray9",
        )
    else:
        ax.text(
            xs[i],
            y,
            f"{d:+,.0f}",
            ha="center",
            va="bottom",
            fontsize=dm.fs(-1),
            color=colors[i],
        )

ax.set_xticks(xs)
ax.set_xticklabels(labels, rotation=20, ha="right")
ax.set_ylabel("Energy (MWh)")
ax.set_ylim(0, max(tops) * 1.15)
dm.format_axis_si(ax, axis="y")

# Legend via proxy patches.
handles = [
    mpatches.Patch(
        facecolor=pos_color, edgecolor="white", label="Positive delta"
    ),
    mpatches.Patch(
        facecolor=neg_color, edgecolor="white", label="Negative delta"
    ),
    mpatches.Patch(facecolor=tot_color, edgecolor="white", label="Subtotal"),
]
ax.legend(handles=handles, loc="upper right", fontsize=dm.fs(-1), frameon=False)

ax.set_title(
    "From 1,200 MWh generated to 440 MWh delivered — loss is the biggest leak",
    fontsize=dm.fs(1),
    fontweight=dm.fw(1),
    loc="left",
    pad=18,
)
ax.text(
    0.0,
    1.02,
    "Synthetic bridge; dashed connectors trace the running total.",
    transform=ax.transAxes,
    ha="left",
    va="bottom",
    fontsize=dm.fs(-1),
    color="oc.gray6",
)

fig.text(
    0.01,
    0.005,
    "Source: synthetic energy-bridge model.",
    fontsize=dm.fs(-2),
    color="oc.gray5",
    ha="left",
    va="bottom",
)

dm.simple_layout(fig, margin=dm.inch(0.12))
dm.validate_with_fixes(fig)

issues = dm.check_figure_quality(fig)
issues = [i for i in issues if "No data" not in i]
if issues:
    print(f"[waterfall-advanced] quality issues: {issues}")

dm.save_formats(fig, "waterfall_advanced")
Total running time of the script: (0 minutes 0.666 seconds)