Interactive UI
dartwork-mpl ships an optional in-browser viewer (FastAPI + Pydantic) for tweaking plot parameters with sliders, downloading the result, and — most importantly — exporting the exact Python script that reproduces what you see. It’s the fastest way to figure out the parameters you actually want before locking them into code.
See it in action
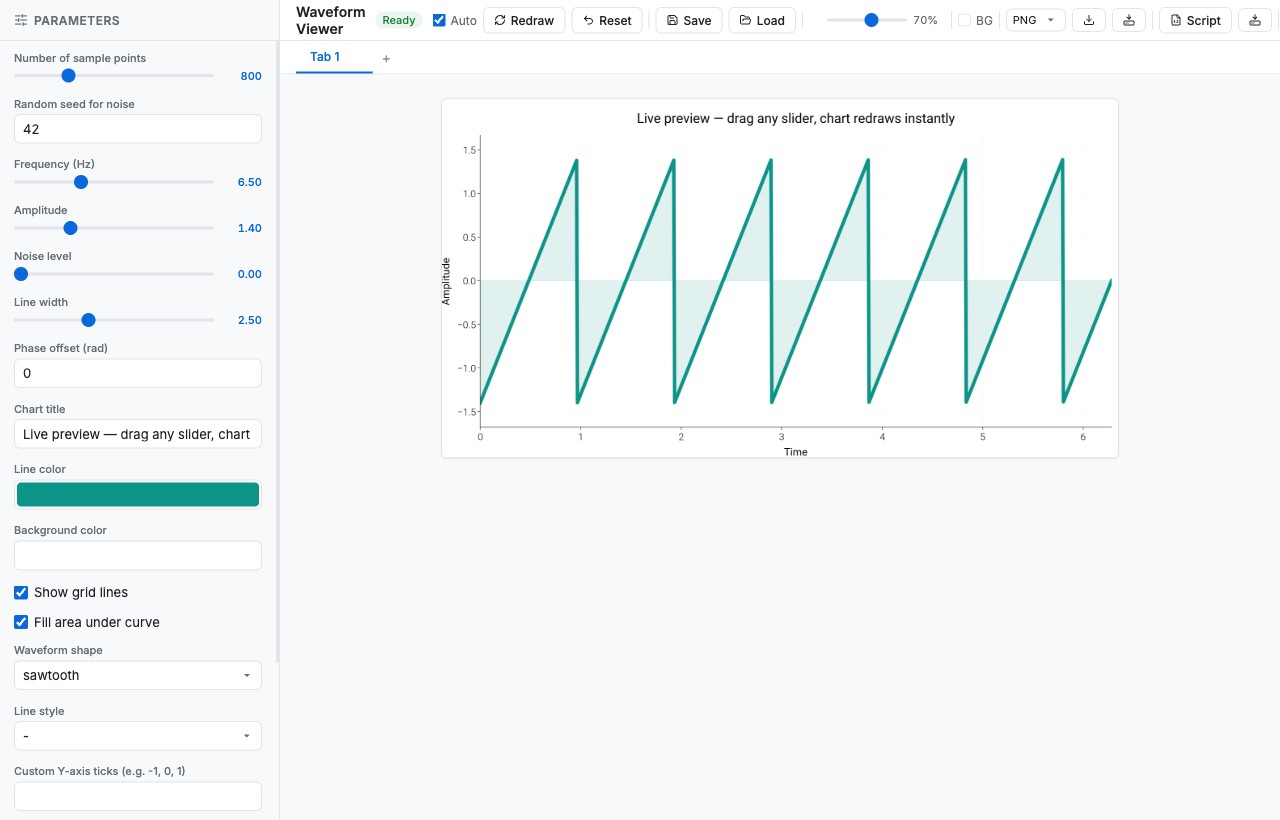
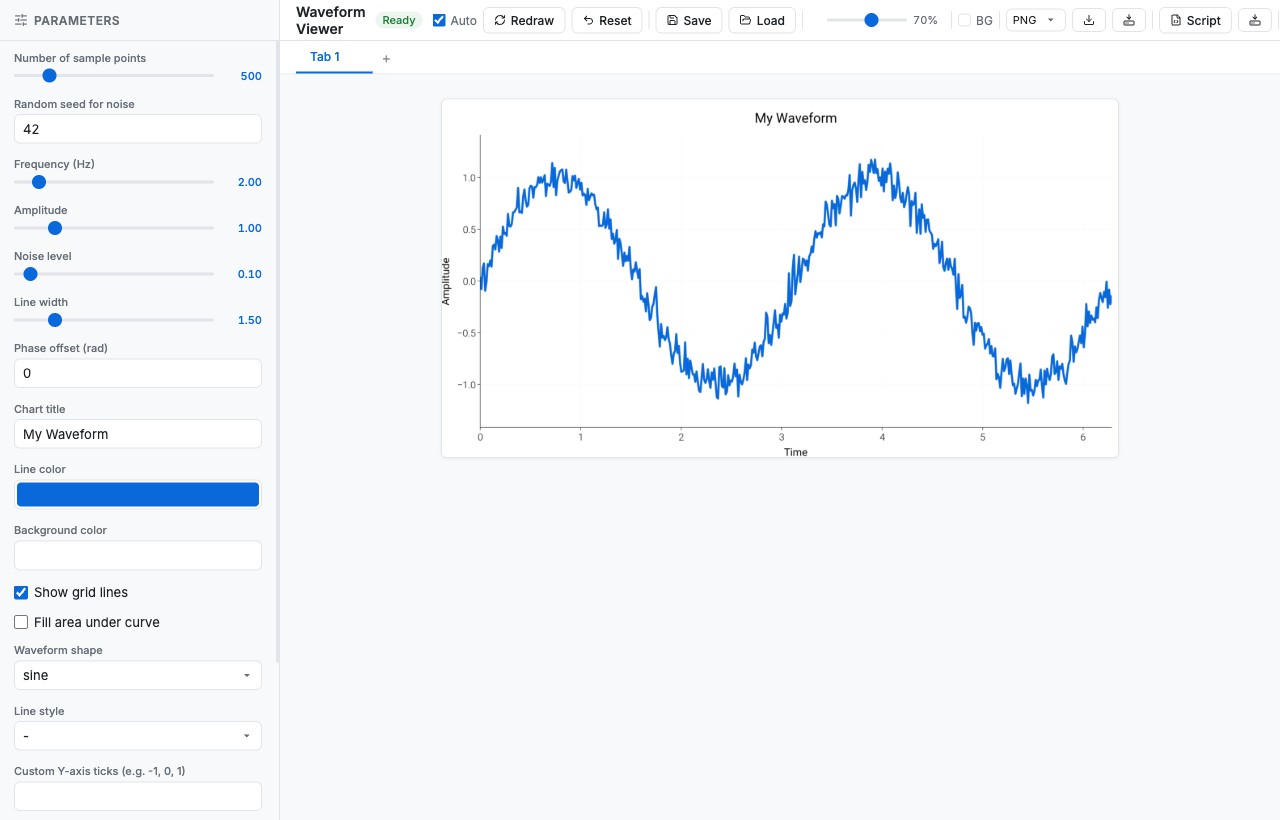
The slider below is the real viewer, captured at two moments:
on the left, the default state right after python viewer.py boots;
on the right, the same UI after a handful of slider/dropdown/color-picker
tweaks. Drag the handle to wipe between them and watch the chart
respond — every control on the left panel is auto-generated from a
Pydantic ParamModel and re-renders the matplotlib figure on the
right in ≈80 ms.
What the UI gives you
A split-pane web app served on a local port (default 8501):
Left panel — auto-generated controls (sliders, text inputs, toggles, dropdowns) derived from your
ParamModelfields.Right panel — live matplotlib figure that re-renders on every change, in any dartwork-mpl style preset.
Bottom bar — Download (PNG / SVG / PDF), Save-to-Server (with optional mirror copies), and Download Script for one-click reproducible export.
Install the optional extra
The interactive UI is gated behind the ui extra:
pip install "dartwork-mpl[ui]"
uv add "dartwork-mpl[ui]"
30-second tour
# 1. scaffold a starter viewer
dartwork-mpl-ui init ./my-viewer --example simple

# 2. run it
cd my-viewer
python viewer.py
# → opens the viewer in your default browser (local server, default port 8501)
Adjust the sliders. When the figure looks right, click
Download Script at the bottom — you get a standalone .py file
that reproduces the figure with no UI dependency.
Building your own viewer
A viewer is two things: a Pydantic ParamModel describing what the
user can tweak, and a function that turns those parameters into a
matplotlib Figure.
import matplotlib.pyplot as plt
import numpy as np
import dartwork_mpl as dm
from dartwork_mpl.ui import ParamModel, run
from pydantic import Field


class ScatterParams(ParamModel):
    n: int = Field(default=100, ge=10, le=1000, description="Number of points")
    alpha: float = Field(default=0.5, ge=0.0, le=1.0, description="Transparency")
    color: str = Field(default="dc.teal2", description="Point color")


def plot_scatter(params: ScatterParams):
    dm.style.use("scientific")
    fig, ax = plt.subplots(figsize=dm.figsize("13cm", "standard"))

    x = np.random.randn(params.n)
    y = np.random.randn(params.n)
    ax.scatter(x, y, alpha=params.alpha, color=params.color)

    dm.simple_layout(fig)
    return fig


if __name__ == "__main__":
    # Starts a local web server (default port 8501) and opens it
    run(plot_scatter)
That’s it. The UI introspects ScatterParams, generates the right
control for each field, and starts re-rendering on every change.
What field type maps to which control?
Pydantic field |
Auto-generated control |
Tip |
|---|---|---|
|
Integer slider |
Always set both bounds for sliders |
|
Float slider |
Add |
|
Number text input |
Free-form numeric entry |
|
Toggle switch |
— |
|
Dropdown |
Cleanest way to expose presets / colors |
|
Text input |
Use |
|
Repeated number inputs |
Good for piecewise breakpoints |
from typing import Literal
from pydantic import Field

class FontParams(ParamModel):
    preset: Literal[
        "scientific", "report", "presentation", "poster",
    ] = Field(default="scientific")
    fs_offset: int = Field(default=0, ge=-3, le=4, description="dm.fs offset")
    bold_title: bool = Field(default=False)
Wire that to a render function and you’ve built a one-page font / preset comparator.
Common patterns
Browse a parameter sweep
Set wide bounds and step through them with the keyboard arrow keys once focus is on a slider:
class SweepParams(ParamModel):
    sigma: float = Field(default=1.0, ge=0.1, le=5.0)
    samples: int = Field(default=500, ge=50, le=5000)
Compare style presets live
from typing import Literal

class PresetParams(ParamModel):
    preset: Literal[
        "scientific", "report", "presentation", "poster", "web", "minimal", "dark",
    ] = Field(default="scientific")

def plot_preset(params: PresetParams):
    dm.style.use(params.preset)
    fig, ax = plt.subplots(figsize=dm.figsize("15cm", "wide"))
    ...
    return fig
Mirror exports to your paper / report directory
run(
    plot_scatter,
    copy_to=["~/Papers/2026-acl/figures/", "../report/figures/"],
)
Every “Save to Server” click also writes a copy into each path in
copy_to, so you can iterate in the UI and keep your manuscript /
slides up to date without manual copying.
Reproducible code export
When you click Download Script, the viewer generates a
self-contained .py file capturing:
Your exact
ParamModeland render function.The current parameter values from the UI.
The minimal boilerplate to recreate the figure with no UI dependency.
# Auto-generated by dartwork-mpl Interactive UI
# Parameters captured at 2026-04-25 14:30:22

from scatter_viewer import ScatterParams, plot_scatter
import dartwork_mpl as dm

params = ScatterParams(n=250, alpha=0.35, color="dc.green2")
fig = plot_scatter(params)
dm.save_formats(fig, "scatter_final", formats=("png", "svg"), dpi=300)
This is the whole reason the UI exists: tune by feel, lock the result into version control, and never ship “I forgot which parameters made this plot” again.
Tip
The viewer respects whatever dm.style.use(...) you call inside the
render function — including dark, report-kr, and stacked styles
like ["scientific", "font-libertine"].
See also
API › Interactive Viewer for all
run(),ParamModel, and CLI arguments.Save and Validation for batch export without the interactive UI.
Design Philosophy for the “Utilities, Not Wrappers” approach behind the UI.