Note
Go to the end to download the full example code.
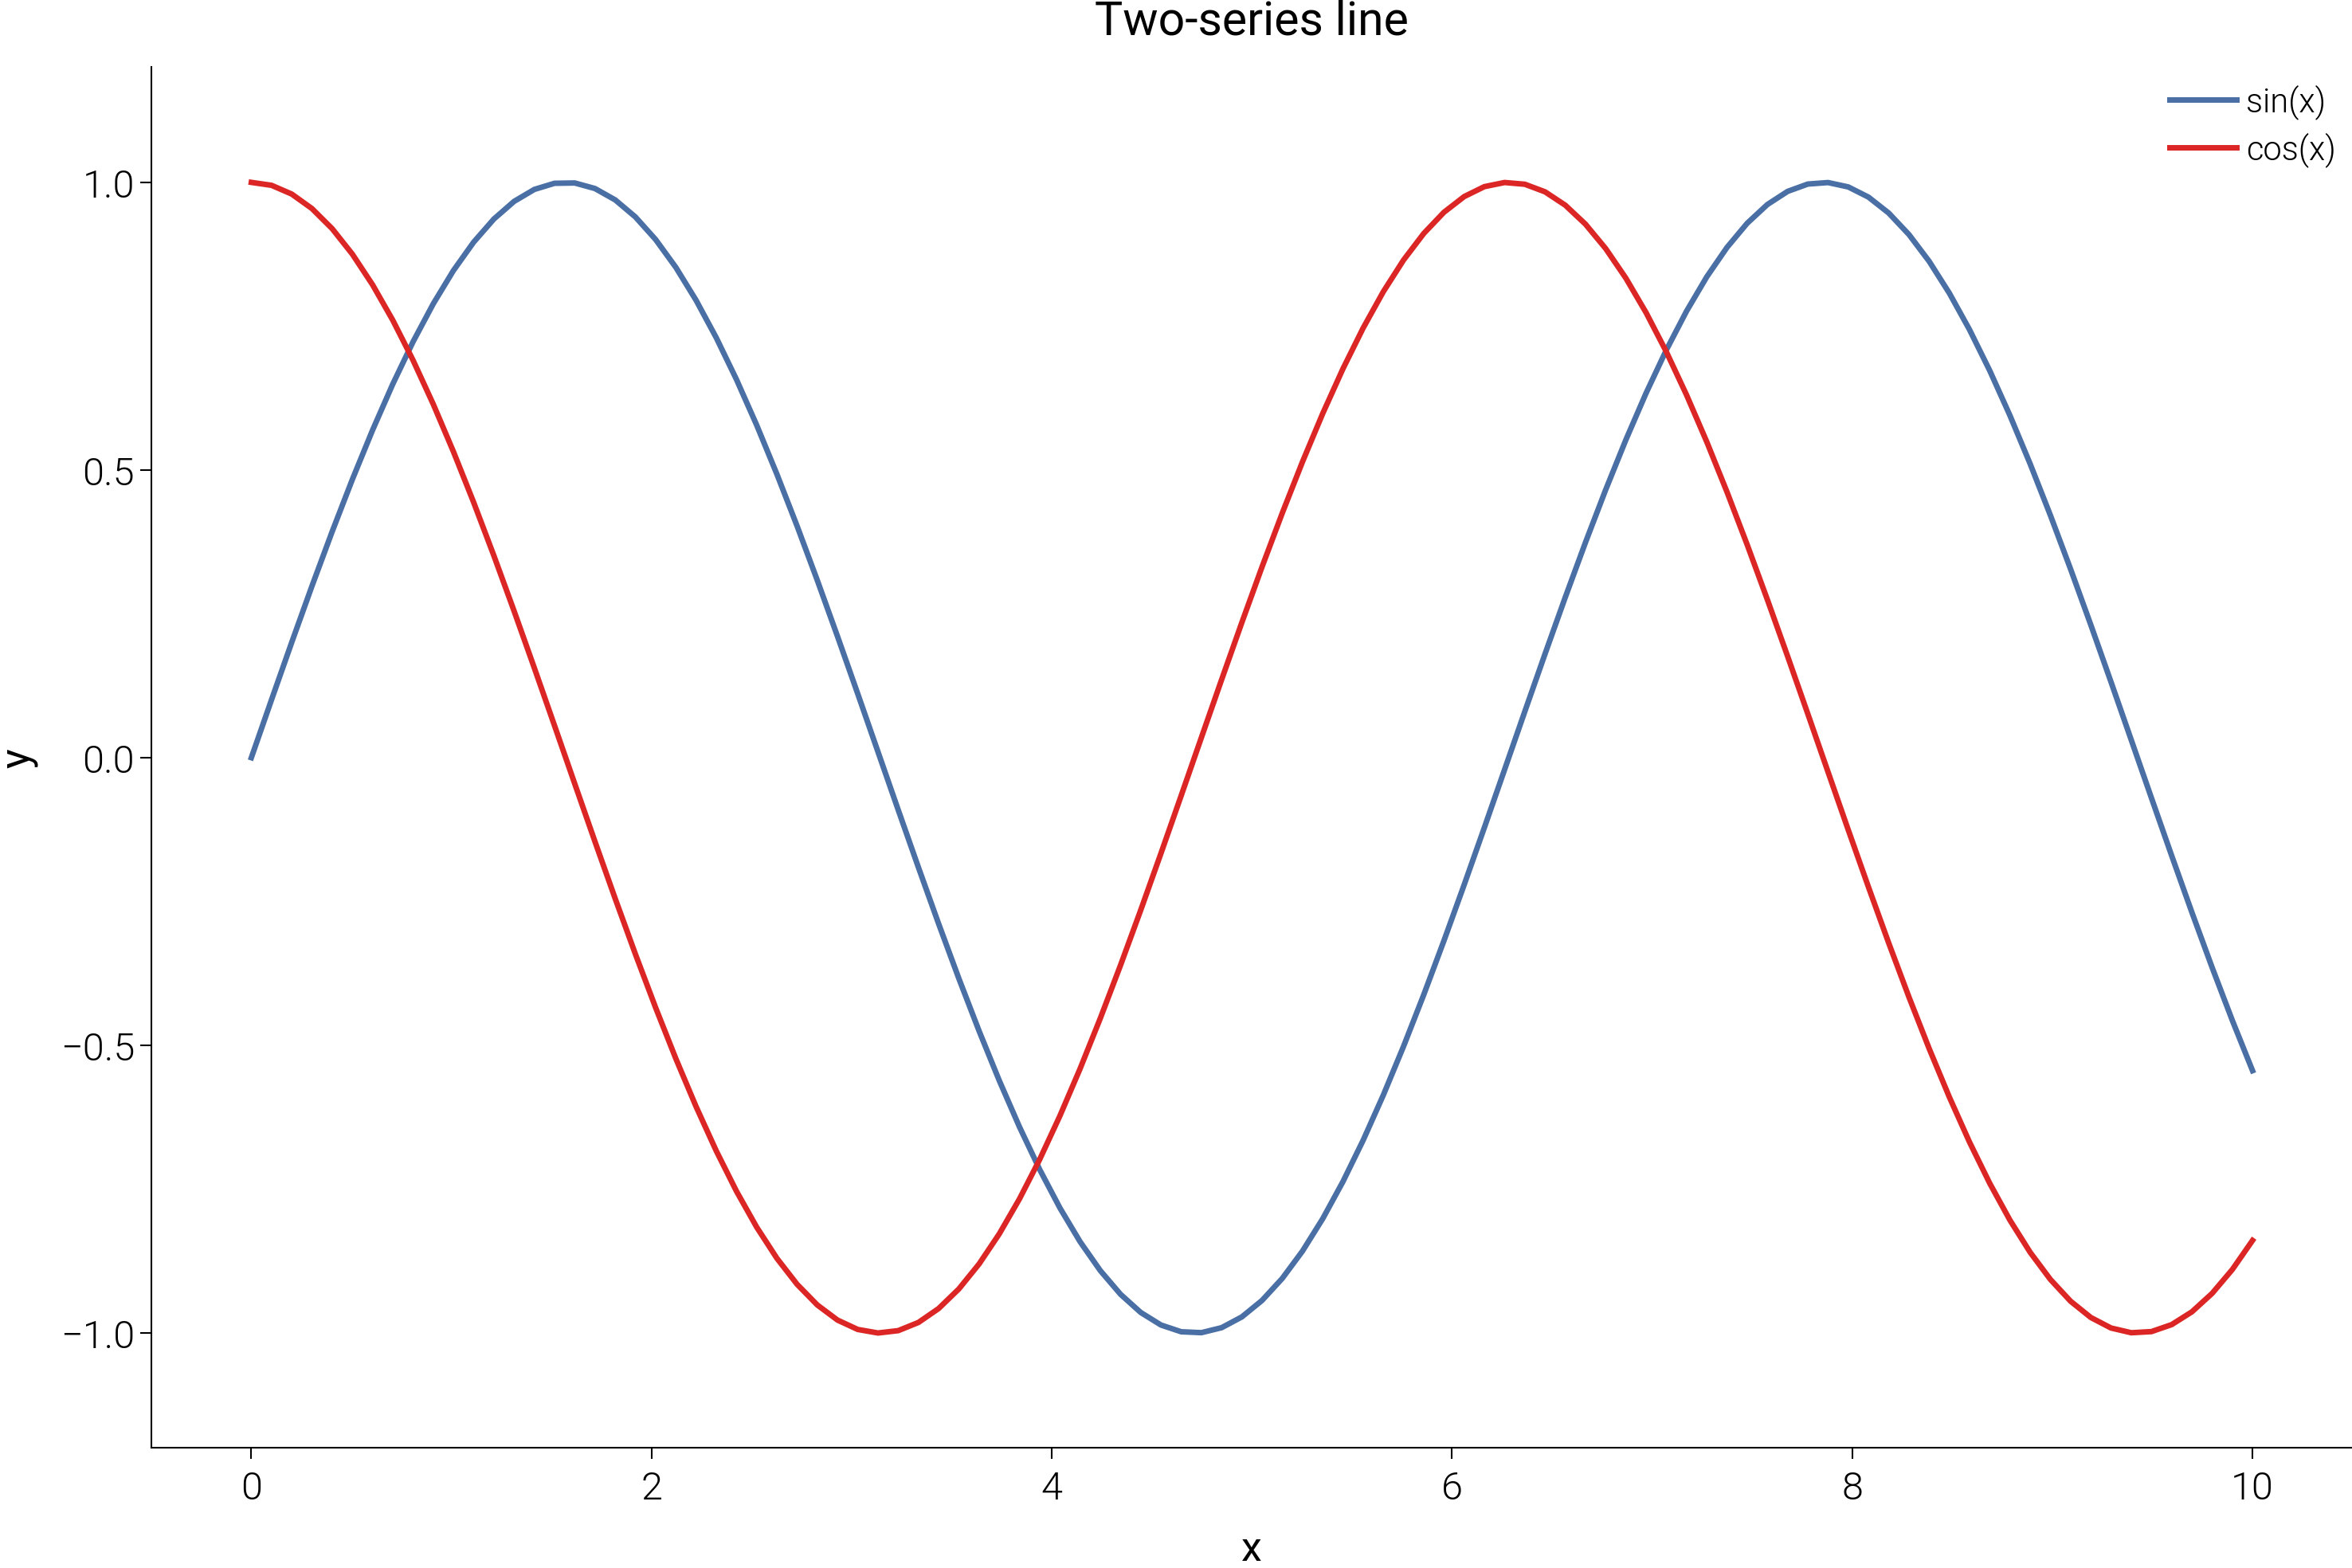
Line
Two-series line chart.
Source: dartwork_mpl/asset/prompt/05-templates/line.py ·
dm.get_prompt("05-templates/line") · MCP dartwork-mpl://templates/line.
# ai-template-meta-start
# use_case: Show a continuous trend over an ordered x axis
# difficulty: beginner
# data_shape: x: list[float], y: list[float]
# tags: line, trend, time-series, continuous
# ai-template-meta-end

import matplotlib.pyplot as plt
import numpy as np

import dartwork_mpl as dm

dm.style.use("scientific")

x = np.linspace(0, 10, 100)
y1, y2 = np.sin(x), np.cos(x)

fig, ax = plt.subplots(figsize=dm.figsize("15cm", "wide"))
ax.plot(x, y1, color="dc.teal3", linewidth=dm.lw(0), label="sin(x)")
ax.plot(x, y2, color="dc.orange3", linewidth=dm.lw(0), label="cos(x)")
ax.set_xlabel("x")
ax.set_ylabel("y")
ax.legend()
ax.set_title("Two-series line", fontsize=dm.fs(1), fontweight=dm.fw(1))

dm.simple_layout(fig)
Total running time of the script: (0 minutes 0.513 seconds)