Note
Go to the end to download the full example code.
Polar (Advanced)
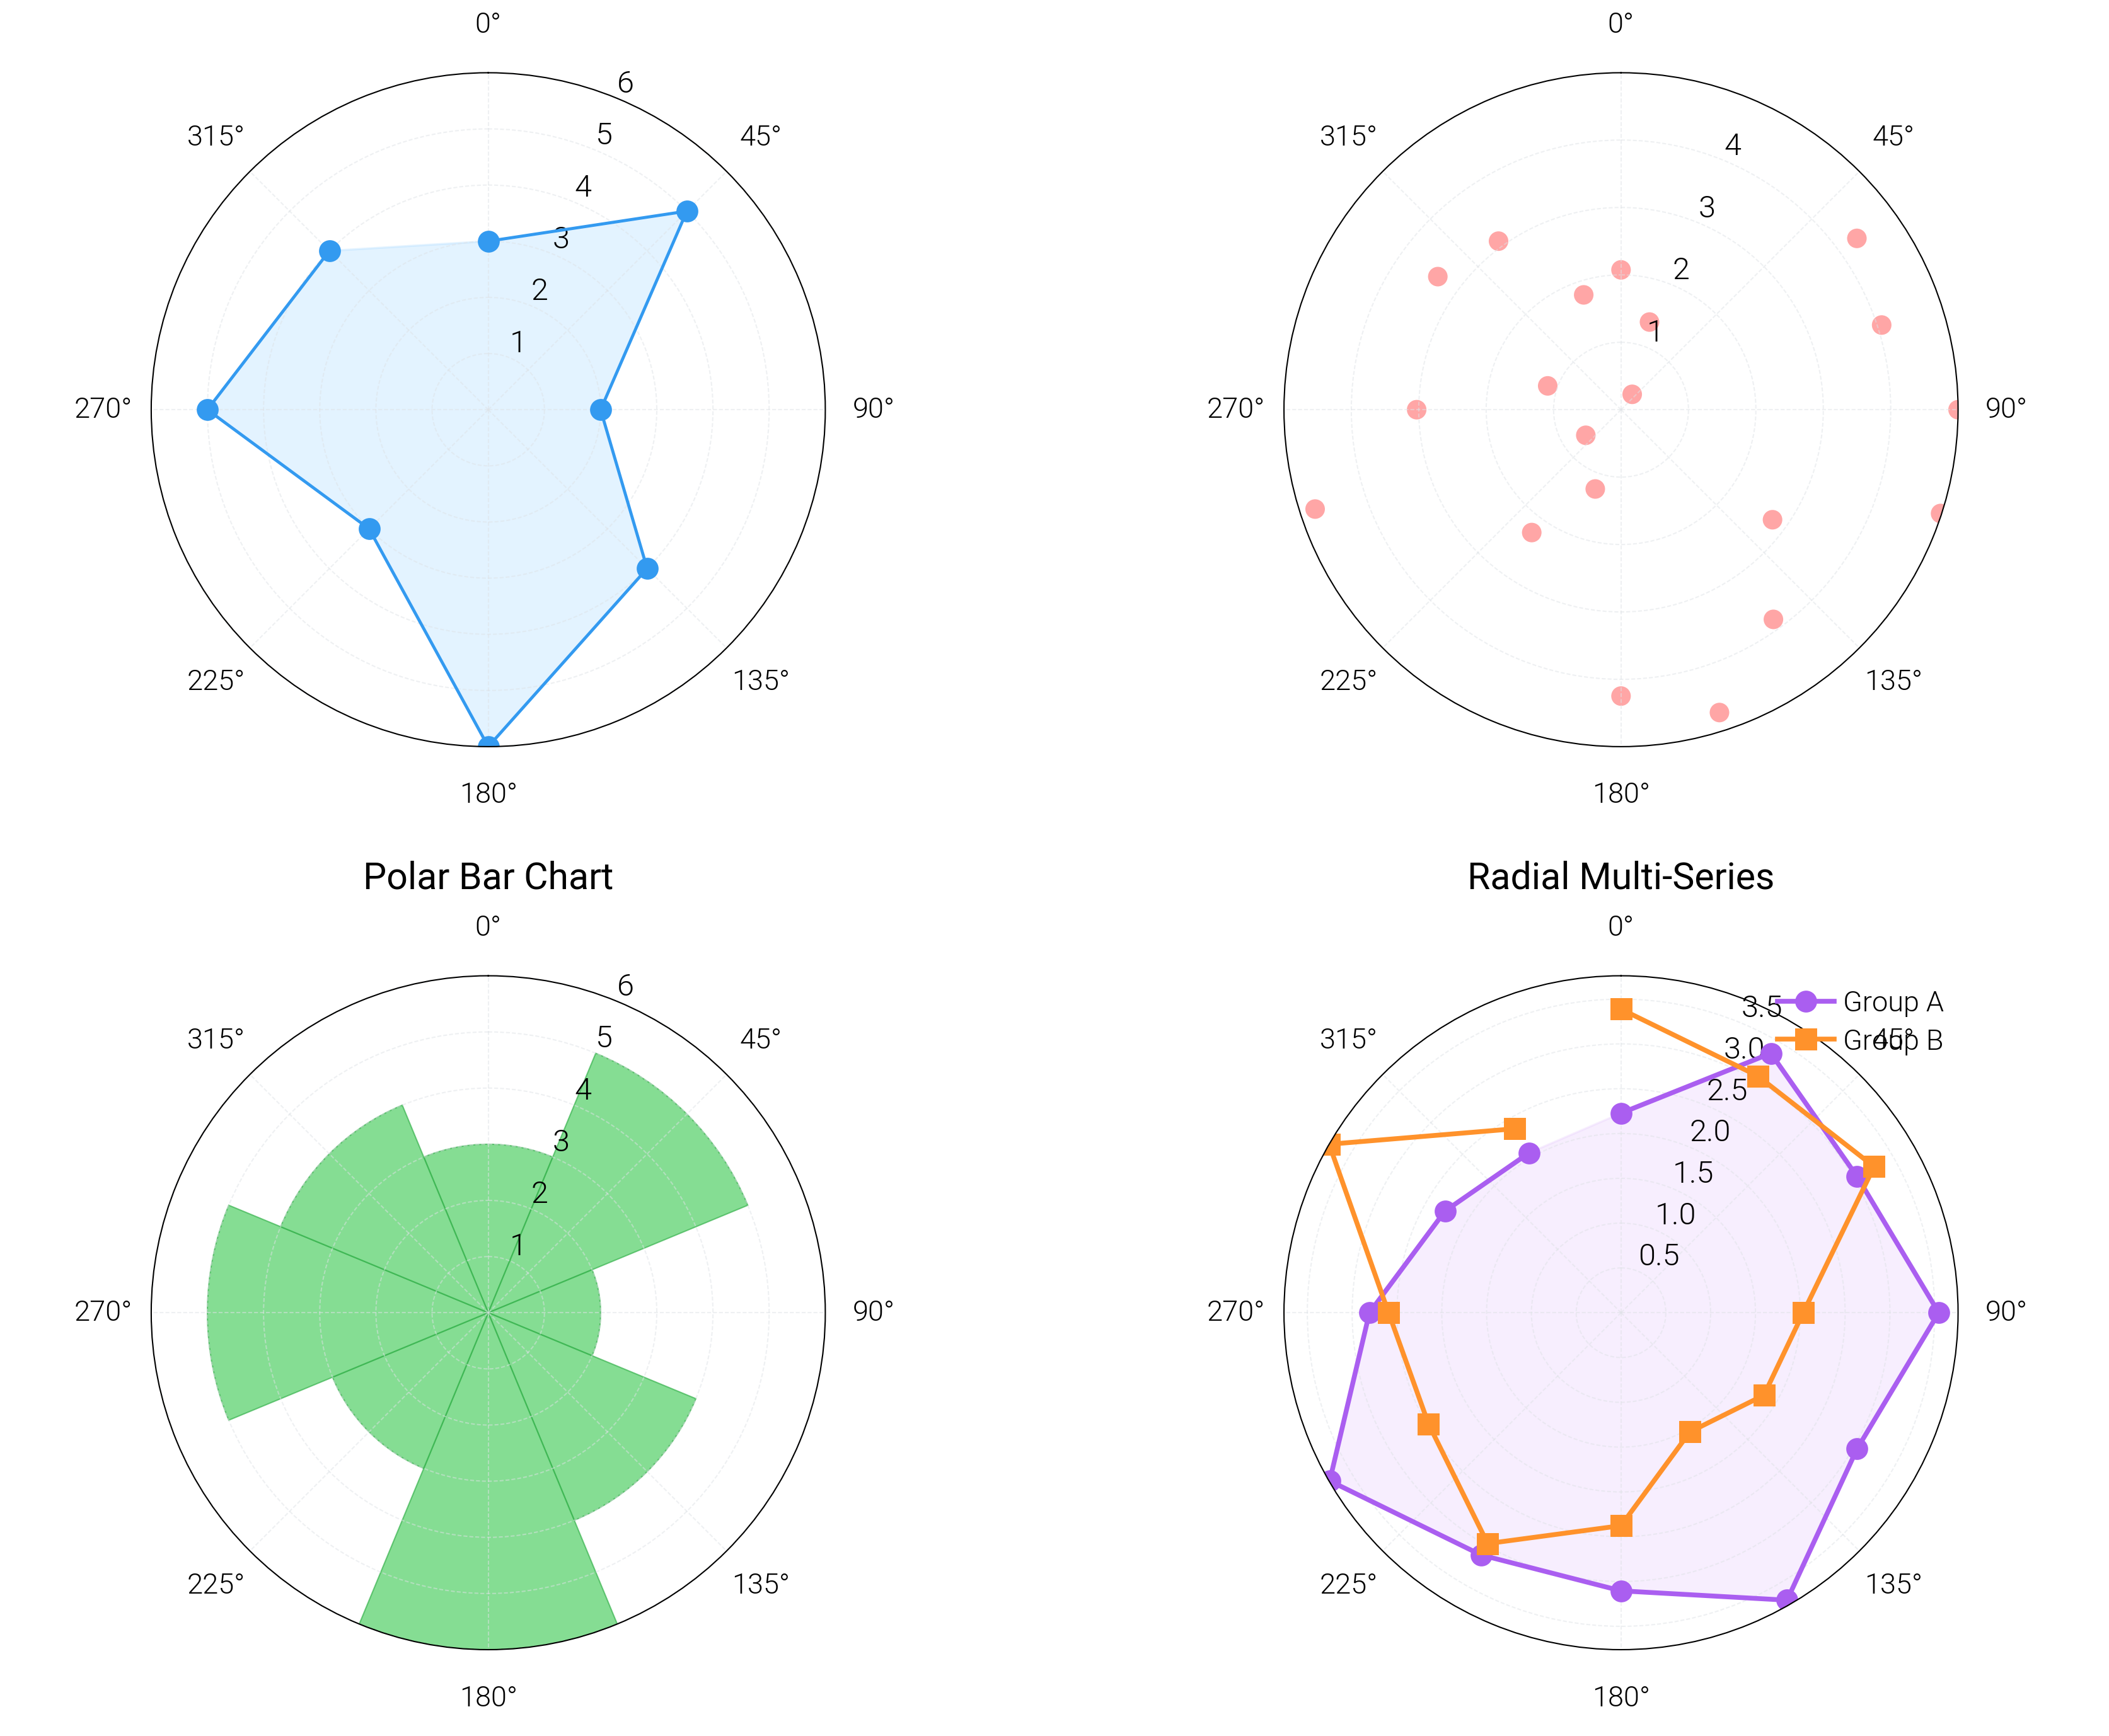
Polar — advanced template (multi-series + cardinal labels + cspace gradient).
Source: dartwork_mpl/asset/prompt/05-templates/advanced/polar.py ·
MCP dartwork-mpl://template/advanced/polar.
[VISUAL] ⚠️  TEXT_CONTRAST: Text contrast 2.07:1 is below the 4.5:1 AA threshold for normal text (sample: 'Source: synthetic load profile (kW vs...')
[VISUAL] 💡 GRAYSCALE_SAFETY: The project modeled-relative-Y proximity heuristic before compositing found source-RGB pairs below its ΔY threshold; inspect ΔEOK separation: #00c897/#abc853, #abc853/#ffbb50

=== FIX SUGGESTIONS ===
[VISUAL] ⚠️  TEXT_CONTRAST: Text contrast 2.07:1 is below the 4.5:1 AA threshold for normal text (sample: 'Source: synthetic load profile (kW vs...')
[VISUAL] 💡 GRAYSCALE_SAFETY: The project modeled-relative-Y proximity heuristic before compositing found source-RGB pairs below its ΔY threshold; inspect ΔEOK separation: #00c897/#abc853, #abc853/#ffbb50
# ai-template-meta-start
# tier: advanced
# basic_counterpart: polar
# use_case: Multi-series radial chart with OKLCH-gradient colors and cardinal-direction labels
# difficulty: advanced
# data_shape: theta: 1D array, r: list of 1D arrays
# tags: polar, radial, multi-series, gradient, narrative
# narrative: Three time-of-day load profiles on a polar axis
# advanced_apis: subplot_kw projection=polar, 3 dm.cspace series, cardinal theta labels, legend below
# ai-template-meta-end

import matplotlib.pyplot as plt
import numpy as np

import dartwork_mpl as dm

dm.style.use("scientific")

# Three load profiles (kW vs. hour-of-day, expressed on a polar axis).
theta = np.linspace(0, 2 * np.pi, 24, endpoint=False)
rng = np.random.default_rng(42)

base = 30 + 10 * np.cos(theta - np.pi)  # late-night low, mid-day high
profiles = {
    "Weekday": base
    + 18 * np.exp(-((theta - 1.8 * np.pi) ** 2) / 0.4)
    + 8 * np.exp(-((theta - 0.4 * np.pi) ** 2) / 0.3),
    "Weekend": base * 0.9 + 12 * np.exp(-((theta - 1.6 * np.pi) ** 2) / 1.0),
    "Holiday": base * 0.7,
}

# OKLCH gradient — three series, perceptually distinct.
gradient = dm.cspace("dc.teal5", "dc.amber4", n=len(profiles))
colors = [c.to_hex() for c in gradient]

fig, ax = plt.subplots(
    figsize=dm.figsize("13cm", "square"), subplot_kw={"projection": "polar"}
)

for (name, r), color in zip(profiles.items(), colors, strict=False):
    # Close the loop.
    theta_loop = np.concatenate([theta, theta[:1]])
    r_loop = np.concatenate([r, r[:1]])
    ax.plot(theta_loop, r_loop, color=color, linewidth=dm.lw(0), label=name)
    ax.fill(theta_loop, r_loop, color=color, alpha=0.10)

# Cardinal-style hour labels — N=midnight, E=06:00, S=12:00, W=18:00.
ax.set_xticks(np.linspace(0, 2 * np.pi, 8, endpoint=False))
ax.set_xticklabels(
    ["00", "03", "06", "09", "12", "15", "18", "21"], fontsize=dm.fs(-1)
)
ax.set_theta_zero_location("N")
ax.set_theta_direction(-1)  # clockwise

ax.set_rlabel_position(135)
ax.tick_params(axis="y", labelsize=dm.fs(-2))

ax.legend(
    loc="upper center",
    bbox_to_anchor=(0.5, -0.06),
    ncol=3,
    fontsize=dm.fs(-1),
    frameon=False,
)

ax.set_title(
    "Weekday load shifts the daily peak to 18:00",
    fontsize=dm.fs(1),
    fontweight=dm.fw(1),
    loc="left",
    pad=18,
)

fig.text(
    0.01,
    0.005,
    "Source: synthetic load profile (kW vs. hour-of-day).",
    fontsize=dm.fs(-2),
    color="oc.gray5",
    ha="left",
    va="bottom",
)

dm.simple_layout(fig, margin=dm.inch(0.12))
dm.validate_with_fixes(fig)

issues = dm.check_figure_quality(fig)
issues = [i for i in issues if "Missing" not in i and "No data" not in i]
if issues:
    print(f"[polar-advanced] quality issues: {issues}")

dm.save_formats(fig, "polar_advanced")
Total running time of the script: (0 minutes 0.864 seconds)