Note
Go to the end to download the full example code.
Tornado (Advanced)
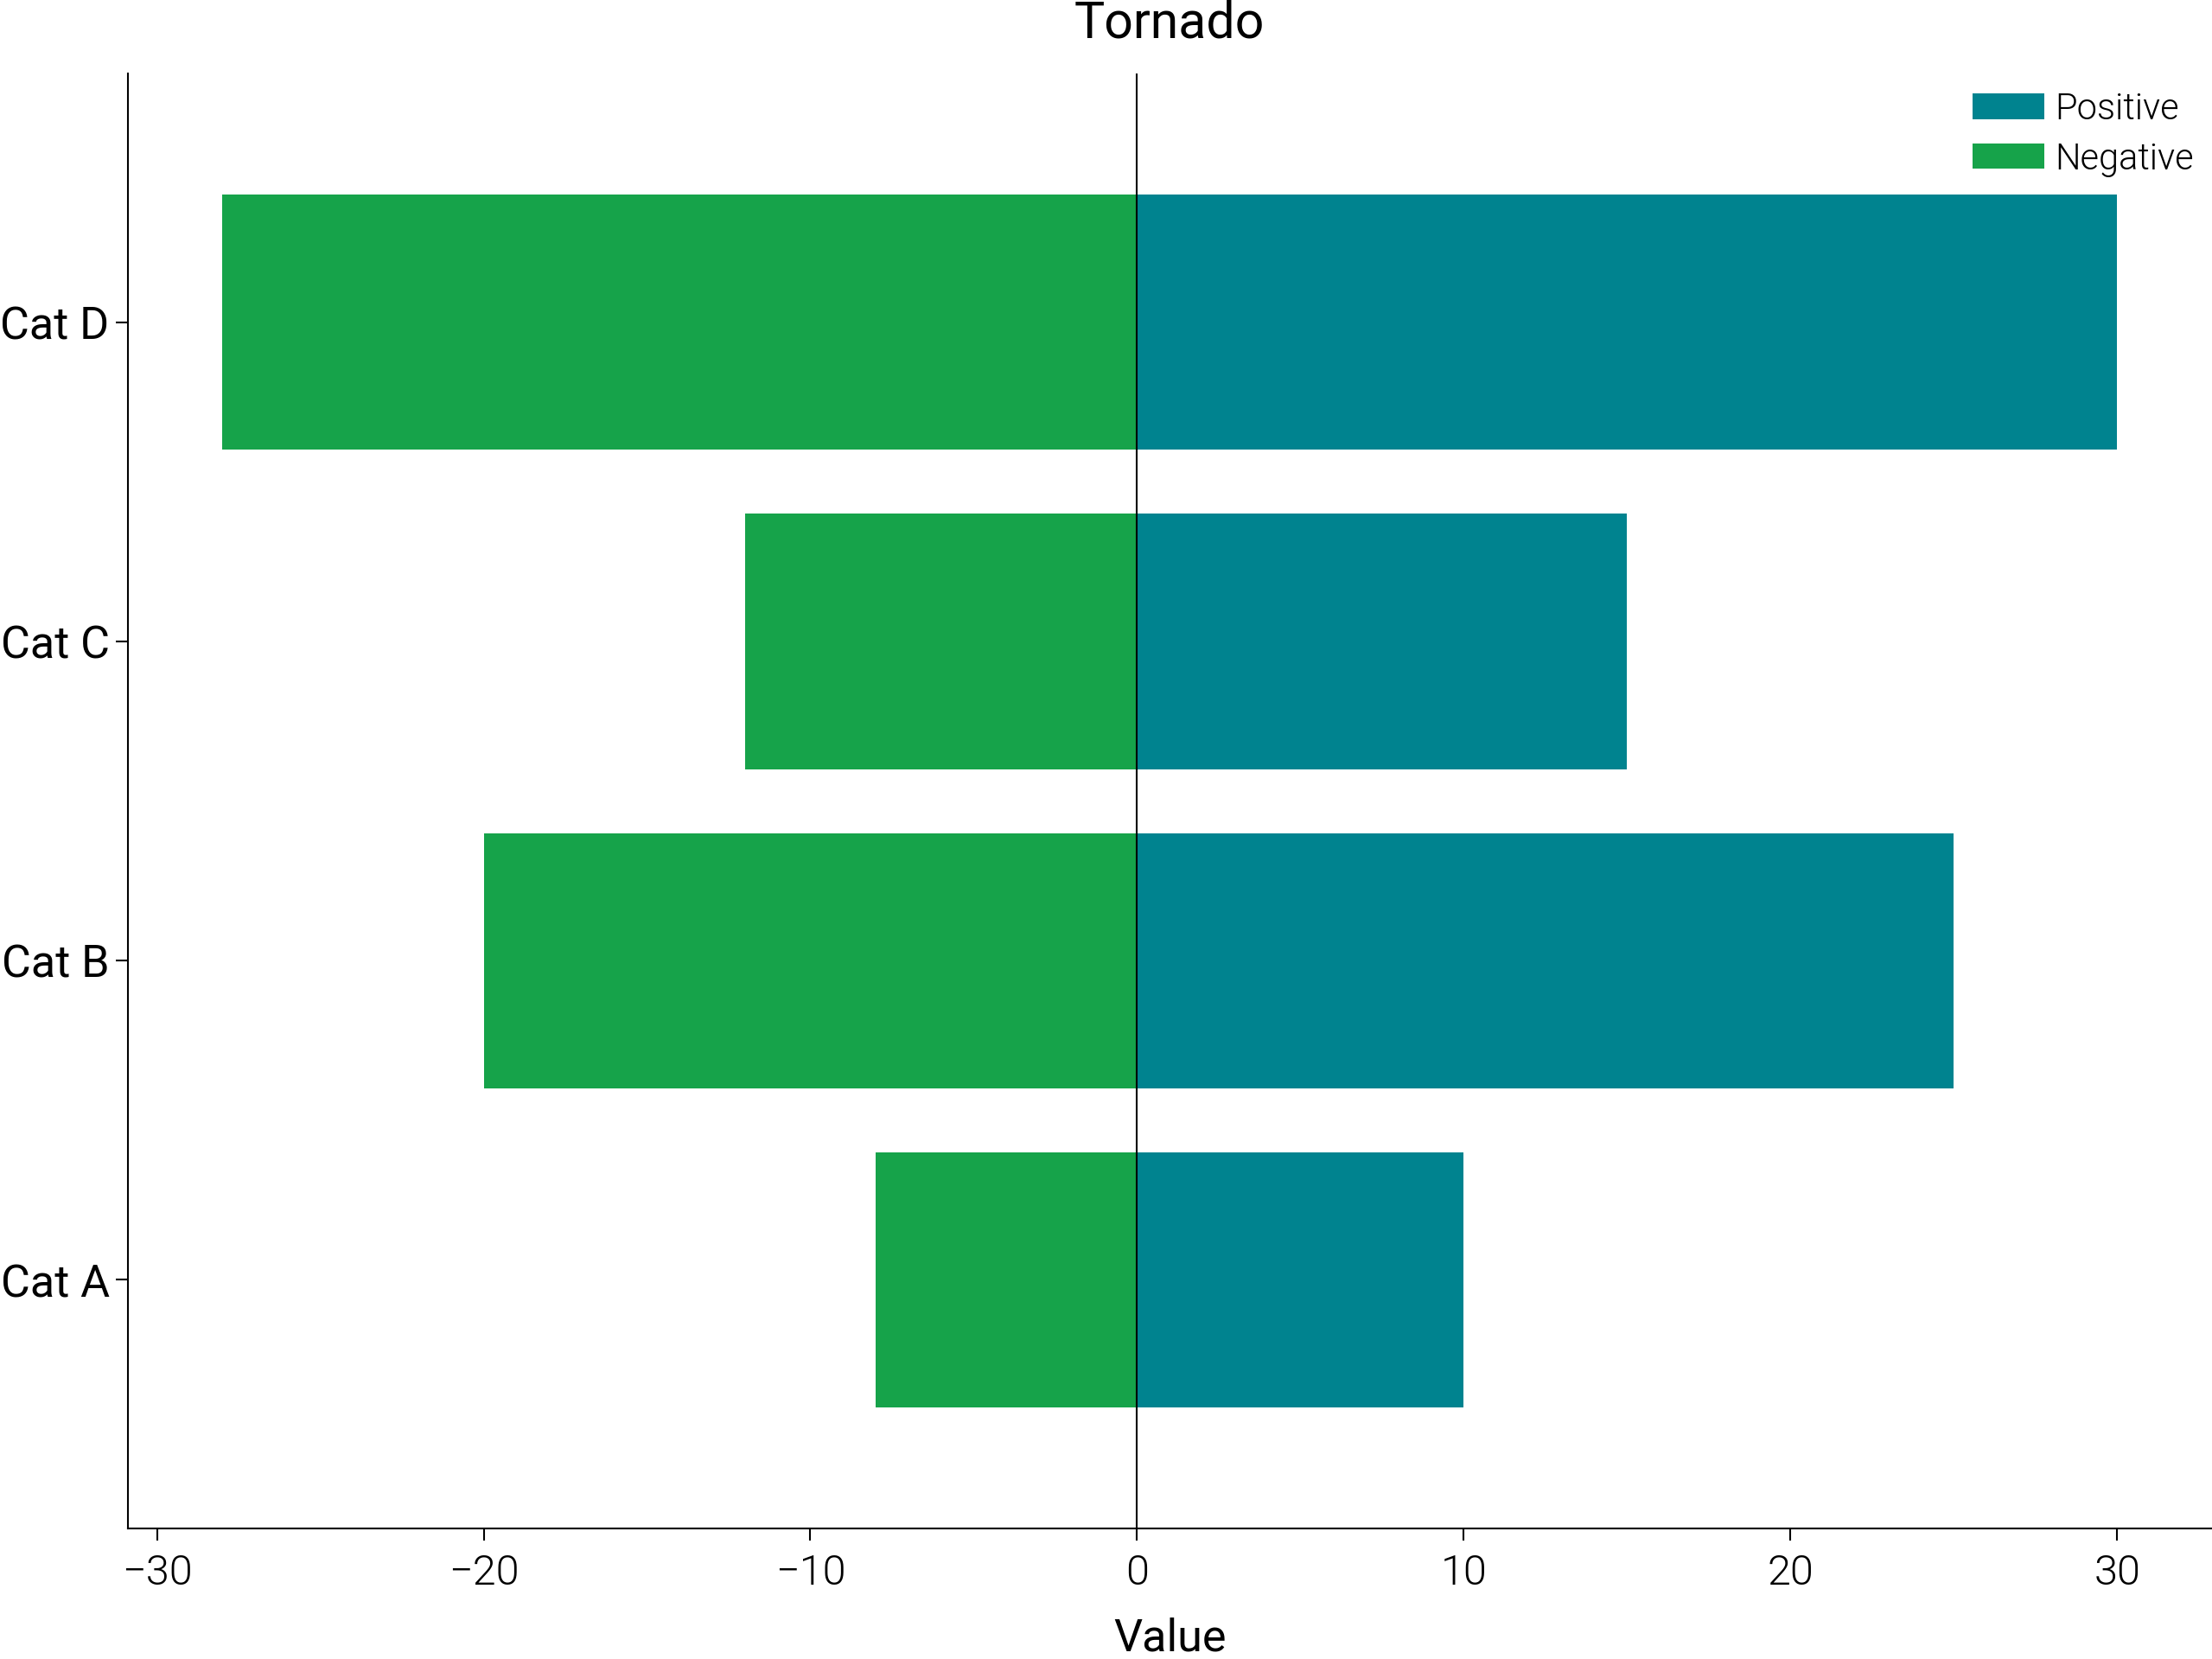
Tornado — advanced template (two-sided sensitivity with baseline).
Source: dartwork_mpl/asset/prompt/05-templates/advanced/tornado.py ·
MCP dartwork-mpl://template/advanced/tornado.
[VISUAL] ⚠️  TEXT_CONTRAST: Text contrast 1.92:1 is below the 4.5:1 AA threshold for normal text across 6 text items (sample: '-22.0%')
[VISUAL] ⚠️  TEXT_CONTRAST: Text contrast 1.99:1 is below the 4.5:1 AA threshold for normal text across 6 text items (sample: '+28.0%')
[VISUAL] 💡 TEXT_CONTRAST: Text contrast 3.32:1 is below the 4.5:1 AA threshold for normal text (sample: 'Each row flexes one parameter by ±10%...')
[VISUAL] ⚠️  TEXT_CONTRAST: Text contrast 2.07:1 is below the 4.5:1 AA threshold for normal text (sample: 'Source: synthetic parameter-sensitivi...')
[VISUAL] 💡 GRAYSCALE_SAFETY: The project modeled-relative-Y proximity heuristic before compositing found source-RGB pairs below its ΔY threshold; inspect ΔEOK separation: #ffa926/#4fd067

=== FIX SUGGESTIONS ===
[tornado-advanced] quality issues: ['Axes 0: Missing y-axis label']
[VISUAL] ⚠️  TEXT_CONTRAST: Text contrast 1.92:1 is below the 4.5:1 AA threshold for normal text across 6 text items (sample: '-22.0%')
[VISUAL] ⚠️  TEXT_CONTRAST: Text contrast 1.99:1 is below the 4.5:1 AA threshold for normal text across 6 text items (sample: '+28.0%')
[VISUAL] 💡 TEXT_CONTRAST: Text contrast 3.32:1 is below the 4.5:1 AA threshold for normal text (sample: 'Each row flexes one parameter by ±10%...')
[VISUAL] ⚠️  TEXT_CONTRAST: Text contrast 2.07:1 is below the 4.5:1 AA threshold for normal text (sample: 'Source: synthetic parameter-sensitivi...')
[VISUAL] 💡 GRAYSCALE_SAFETY: The project modeled-relative-Y proximity heuristic before compositing found source-RGB pairs below its ΔY threshold; inspect ΔEOK separation: #ffa926/#4fd067
# ai-template-meta-start
# tier: advanced
# basic_counterpart: tornado
# use_case: Parameter sensitivity ranking with two-sided bars colored by direction of output impact
# difficulty: intermediate
# data_shape: variables: list[str], low_impact: list[float], high_impact: list[float]
# tags: tornado, sensitivity, two-sided, ranking, narrative
# narrative: Six model parameters ranked by absolute impact on output; output drops red, output rises green
# advanced_apis: horizontal bars at axvline x=0, color by sign of effect, signed value labels
# ai-template-meta-end

import matplotlib.patches as mpatches
import matplotlib.pyplot as plt
import numpy as np

import dartwork_mpl as dm

dm.style.use("scientific")

# (variable, low_scenario_impact, high_scenario_impact) — impact on model output.
# For parameters where higher input drives output down, the pair is flipped.
data = [
    ("Growth", -22.0, +28.0),
    ("Yield", -18.5, +21.0),
    ("Friction", +14.0, -16.5),
    ("Drift", -11.0, +13.0),
    ("Decay", +9.0, -10.5),
    ("Noise", +6.5, -7.5),
]
data.sort(key=lambda r: max(abs(r[1]), abs(r[2])), reverse=True)
variables = [r[0] for r in data]
low = np.array([r[1] for r in data])
high = np.array([r[2] for r in data])

pos_color = dm.color("dc.green5").to_hex()
neg_color = dm.color("dc.amber5").to_hex()

fig, ax = plt.subplots(figsize=dm.figsize("14.5cm", "standard"))
ys = np.arange(len(variables))

# Color by sign of output impact — green = output rises, red = output drops.
for y_pos, lo, hi in zip(ys, low, high, strict=False):
    ax.barh(
        y_pos,
        lo,
        color=(pos_color if lo >= 0 else neg_color),
        edgecolor="white",
        linewidth=0.3,
    )
    ax.barh(
        y_pos,
        hi,
        color=(pos_color if hi >= 0 else neg_color),
        edgecolor="white",
        linewidth=0.3,
    )

ax.axvline(0, color="oc.gray7", linewidth=0.5, zorder=3)

# Signed value labels on outer end of each bar.
for y_pos, lo, hi in zip(ys, low, high, strict=False):
    ax.text(
        lo + (-1 if lo < 0 else 1) * 0.6,
        y_pos,
        f"{lo:+.1f}%",
        va="center",
        ha="right" if lo < 0 else "left",
        fontsize=dm.fs(-1),
        color=(pos_color if lo >= 0 else neg_color),
    )
    ax.text(
        hi + (-1 if hi < 0 else 1) * 0.6,
        y_pos,
        f"{hi:+.1f}%",
        va="center",
        ha="right" if hi < 0 else "left",
        fontsize=dm.fs(-1),
        color=(pos_color if hi >= 0 else neg_color),
    )

ax.set_yticks(ys)
ax.set_yticklabels(variables)
ax.invert_yaxis()
ax.set_xlabel("Impact on model output (%)")
xmax = max(abs(low).max(), abs(high).max()) * 1.20
ax.set_xlim(-xmax, xmax)

handles = [
    mpatches.Patch(
        facecolor=pos_color, edgecolor="white", label="Output rises"
    ),
    mpatches.Patch(
        facecolor=neg_color, edgecolor="white", label="Output drops"
    ),
]
ax.legend(handles=handles, loc="lower right", fontsize=dm.fs(-1), frameon=False)

ax.set_title(
    "Growth dominates model parameter sensitivity",
    fontsize=dm.fs(1),
    fontweight=dm.fw(1),
    loc="left",
    pad=18,
)
ax.text(
    0.0,
    1.02,
    "Each row flexes one parameter by ±10%; bars colored by sign of output impact.",
    transform=ax.transAxes,
    ha="left",
    va="bottom",
    fontsize=dm.fs(-1),
    color="oc.gray6",
)

fig.text(
    0.01,
    0.005,
    "Source: synthetic parameter-sensitivity model.",
    fontsize=dm.fs(-2),
    color="oc.gray5",
    ha="left",
    va="bottom",
)

dm.simple_layout(fig, margin=dm.inch(0.45))
dm.validate_with_fixes(fig)

issues = dm.check_figure_quality(fig)
issues = [i for i in issues if "No data" not in i]
if issues:
    print(f"[tornado-advanced] quality issues: {issues}")

dm.save_formats(fig, "tornado_advanced")
Total running time of the script: (0 minutes 0.587 seconds)