Note
Go to the end to download the full example code.
Contour (Advanced)
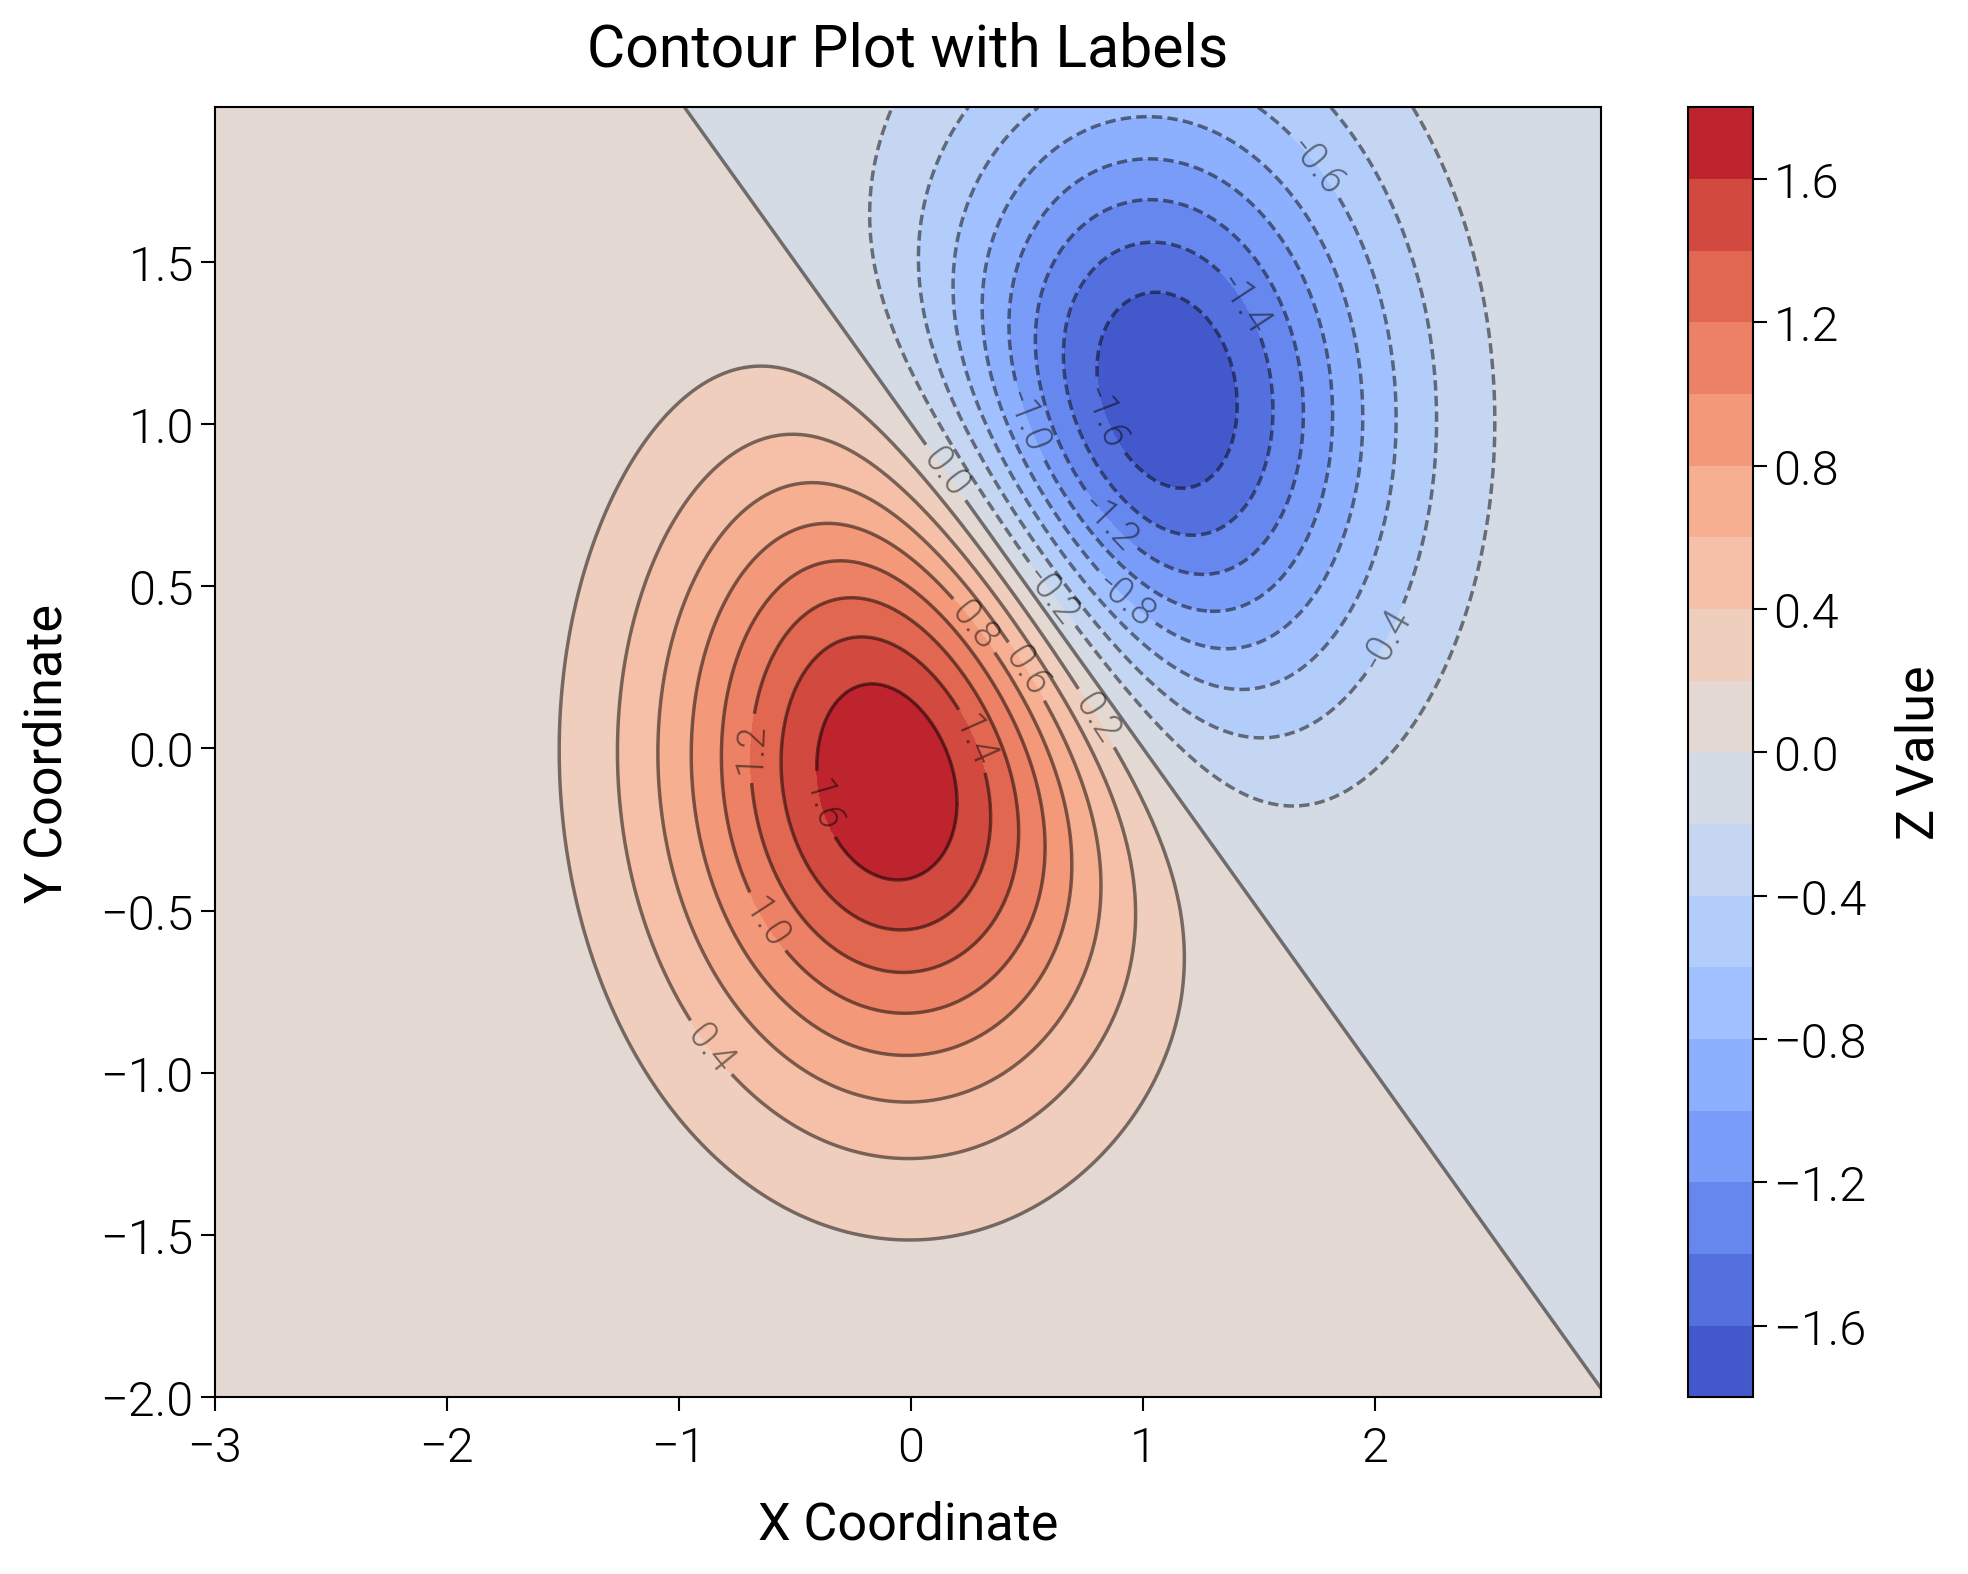
Contour — advanced template (filled + line overlay + peak callouts).
Source: dartwork_mpl/asset/prompt/05-templates/advanced/contour.py ·
MCP dartwork-mpl://template/advanced/contour.
[VISUAL] 💡 TICK_DECIMAL: Y-axis[1]: excess precision in tick labels (4 decimals; 1 recommended)
[VISUAL] ⚠️  TEXT_CONTRAST: Text contrast 1.00:1 is below the 4.5:1 AA threshold for normal text across 7 text items (sample: '0.20')
[VISUAL] ⚠️  TEXT_CONTRAST: Text contrast 1.92:1 is below the 4.5:1 AA threshold for normal text across 2 text items (sample: 'Peak 1 (-1.0, -0.5) z = 1.00')
[VISUAL] 💡 TEXT_CONTRAST: Text contrast 3.32:1 is below the 4.5:1 AA threshold for normal text (sample: 'Filled + line contours; stars mark th...')
[VISUAL] ⚠️  TEXT_CONTRAST: Text contrast 2.07:1 is below the 4.5:1 AA threshold for normal text (sample: 'Source: synthetic two-gaussian field.')
[VISUAL] 💡 GRAYSCALE_SAFETY: The project modeled-relative-Y proximity heuristic before compositing found source-RGB pairs below its ΔY threshold; inspect ΔEOK separation: #471365/#463480, #471365/#3b528b, #463480/#3b528b, #463480/#2f6c8e, #3b528b/#2f6c8e, #2f6c8e/#25848e (+4 more)

=== FIX SUGGESTIONS ===

TICK_DECIMAL: Y-axis[1]: excess precision in tick labels (4 decimals; 1 recommended)
  Option 1:
    # Match tick precision to the tick step
    ax.yaxis.set_major_formatter(mticker.StrMethodFormatter('{x:.1f}'))
  Option 2:
    # Or let matplotlib choose compact numeric labels
    ax.yaxis.set_major_formatter(mticker.ScalarFormatter())
[contour-advanced] quality issues: ['Axes 1: Missing x-axis label']
[VISUAL] 💡 TICK_DECIMAL: Y-axis[1]: excess precision in tick labels (4 decimals; 1 recommended)
[VISUAL] ⚠️  TEXT_CONTRAST: Text contrast 1.00:1 is below the 4.5:1 AA threshold for normal text across 7 text items (sample: '0.20')
[VISUAL] ⚠️  TEXT_CONTRAST: Text contrast 1.92:1 is below the 4.5:1 AA threshold for normal text across 2 text items (sample: 'Peak 1 (-1.0, -0.5) z = 1.00')
[VISUAL] 💡 TEXT_CONTRAST: Text contrast 3.32:1 is below the 4.5:1 AA threshold for normal text (sample: 'Filled + line contours; stars mark th...')
[VISUAL] ⚠️  TEXT_CONTRAST: Text contrast 2.07:1 is below the 4.5:1 AA threshold for normal text (sample: 'Source: synthetic two-gaussian field.')
[VISUAL] 💡 GRAYSCALE_SAFETY: The project modeled-relative-Y proximity heuristic before compositing found source-RGB pairs below its ΔY threshold; inspect ΔEOK separation: #471365/#463480, #471365/#3b528b, #463480/#3b528b, #463480/#2f6c8e, #3b528b/#2f6c8e, #2f6c8e/#25848e (+4 more)
# ai-template-meta-start
# tier: advanced
# basic_counterpart: contour
# use_case: 2D scalar field with filled contour + line overlay + peak annotations
# difficulty: advanced
# data_shape: x: 1D array, y: 1D array, z: 2D array
# tags: contour, 2d-scalar, peaks, annotated, narrative
# narrative: gaussian-mixture landscape with two peaks; both annotated
# advanced_apis: contourf + contour overlay with clabel, ax.scatter on peak coords with annotate, colorbar
# ai-template-meta-end

import matplotlib.pyplot as plt
import numpy as np

import dartwork_mpl as dm

dm.style.use("scientific")

# Two-gaussian energy landscape on a grid.
x = np.linspace(-3, 3, 200)
y = np.linspace(-3, 3, 200)
X, Y = np.meshgrid(x, y)

peaks = [(-1.0, -0.5, 1.0, 0.6), (1.2, 1.0, 0.7, 0.45)]  # cx, cy, amp, sigma
Z = np.zeros_like(X)
for cx, cy, amp, sigma in peaks:
    Z += amp * np.exp(-((X - cx) ** 2 + (Y - cy) ** 2) / (2 * sigma**2))

fig, ax = plt.subplots(figsize=dm.figsize("13cm", "square"))

# Filled contour (background) + line contour (foreground) for layering.
levels = np.linspace(0, Z.max(), 11)
cf = ax.contourf(X, Y, Z, levels=levels, cmap="viridis", alpha=0.85)
cs = ax.contour(X, Y, Z, levels=levels[::2], colors="white", linewidths=0.3)
ax.clabel(cs, inline=True, fontsize=dm.fs(-2), fmt="%.2f", colors="white")

# Peak markers + callouts.
for i, (cx, cy, amp, _) in enumerate(peaks):
    ax.scatter(
        cx,
        cy,
        s=40,
        color="dc.amber5",
        edgecolor="white",
        linewidth=0.5,
        zorder=5,
        marker="*",
    )
    ax.annotate(
        f"Peak {i + 1}\n({cx:+.1f}, {cy:+.1f})\nz = {amp:.2f}",
        xy=(cx, cy),
        xytext=(cx + 0.4, cy + 0.6),
        fontsize=dm.fs(-1),
        color="dc.amber5",
        arrowprops={"arrowstyle": "->", "color": "dc.amber5", "lw": 0.5},
    )

ax.set_xlabel("x")
ax.set_ylabel("y")
ax.set_aspect("equal")

cbar = fig.colorbar(cf, ax=ax, fraction=0.046, pad=0.04)
cbar.set_label("z", fontsize=dm.fs(-1))
cbar.ax.tick_params(labelsize=dm.fs(-1))
cbar.outline.set_linewidth(0.3)

ax.set_title(
    "Twin gaussian peaks dominate the landscape",
    fontsize=dm.fs(1),
    fontweight=dm.fw(1),
    loc="left",
    pad=18,
)
ax.text(
    0.0,
    1.02,
    "Filled + line contours; stars mark the local maxima.",
    transform=ax.transAxes,
    ha="left",
    va="bottom",
    fontsize=dm.fs(-1),
    color="oc.gray6",
)

fig.text(
    0.01,
    0.005,
    "Source: synthetic two-gaussian field.",
    fontsize=dm.fs(-2),
    color="oc.gray5",
    ha="left",
    va="bottom",
)

dm.simple_layout(fig, margin=dm.inch(0.08))
dm.validate_with_fixes(fig)

issues = dm.check_figure_quality(fig)
if issues:
    print(f"[contour-advanced] quality issues: {issues}")

dm.save_formats(fig, "contour_advanced")
Total running time of the script: (0 minutes 0.879 seconds)