Note
Go to the end to download the full example code.
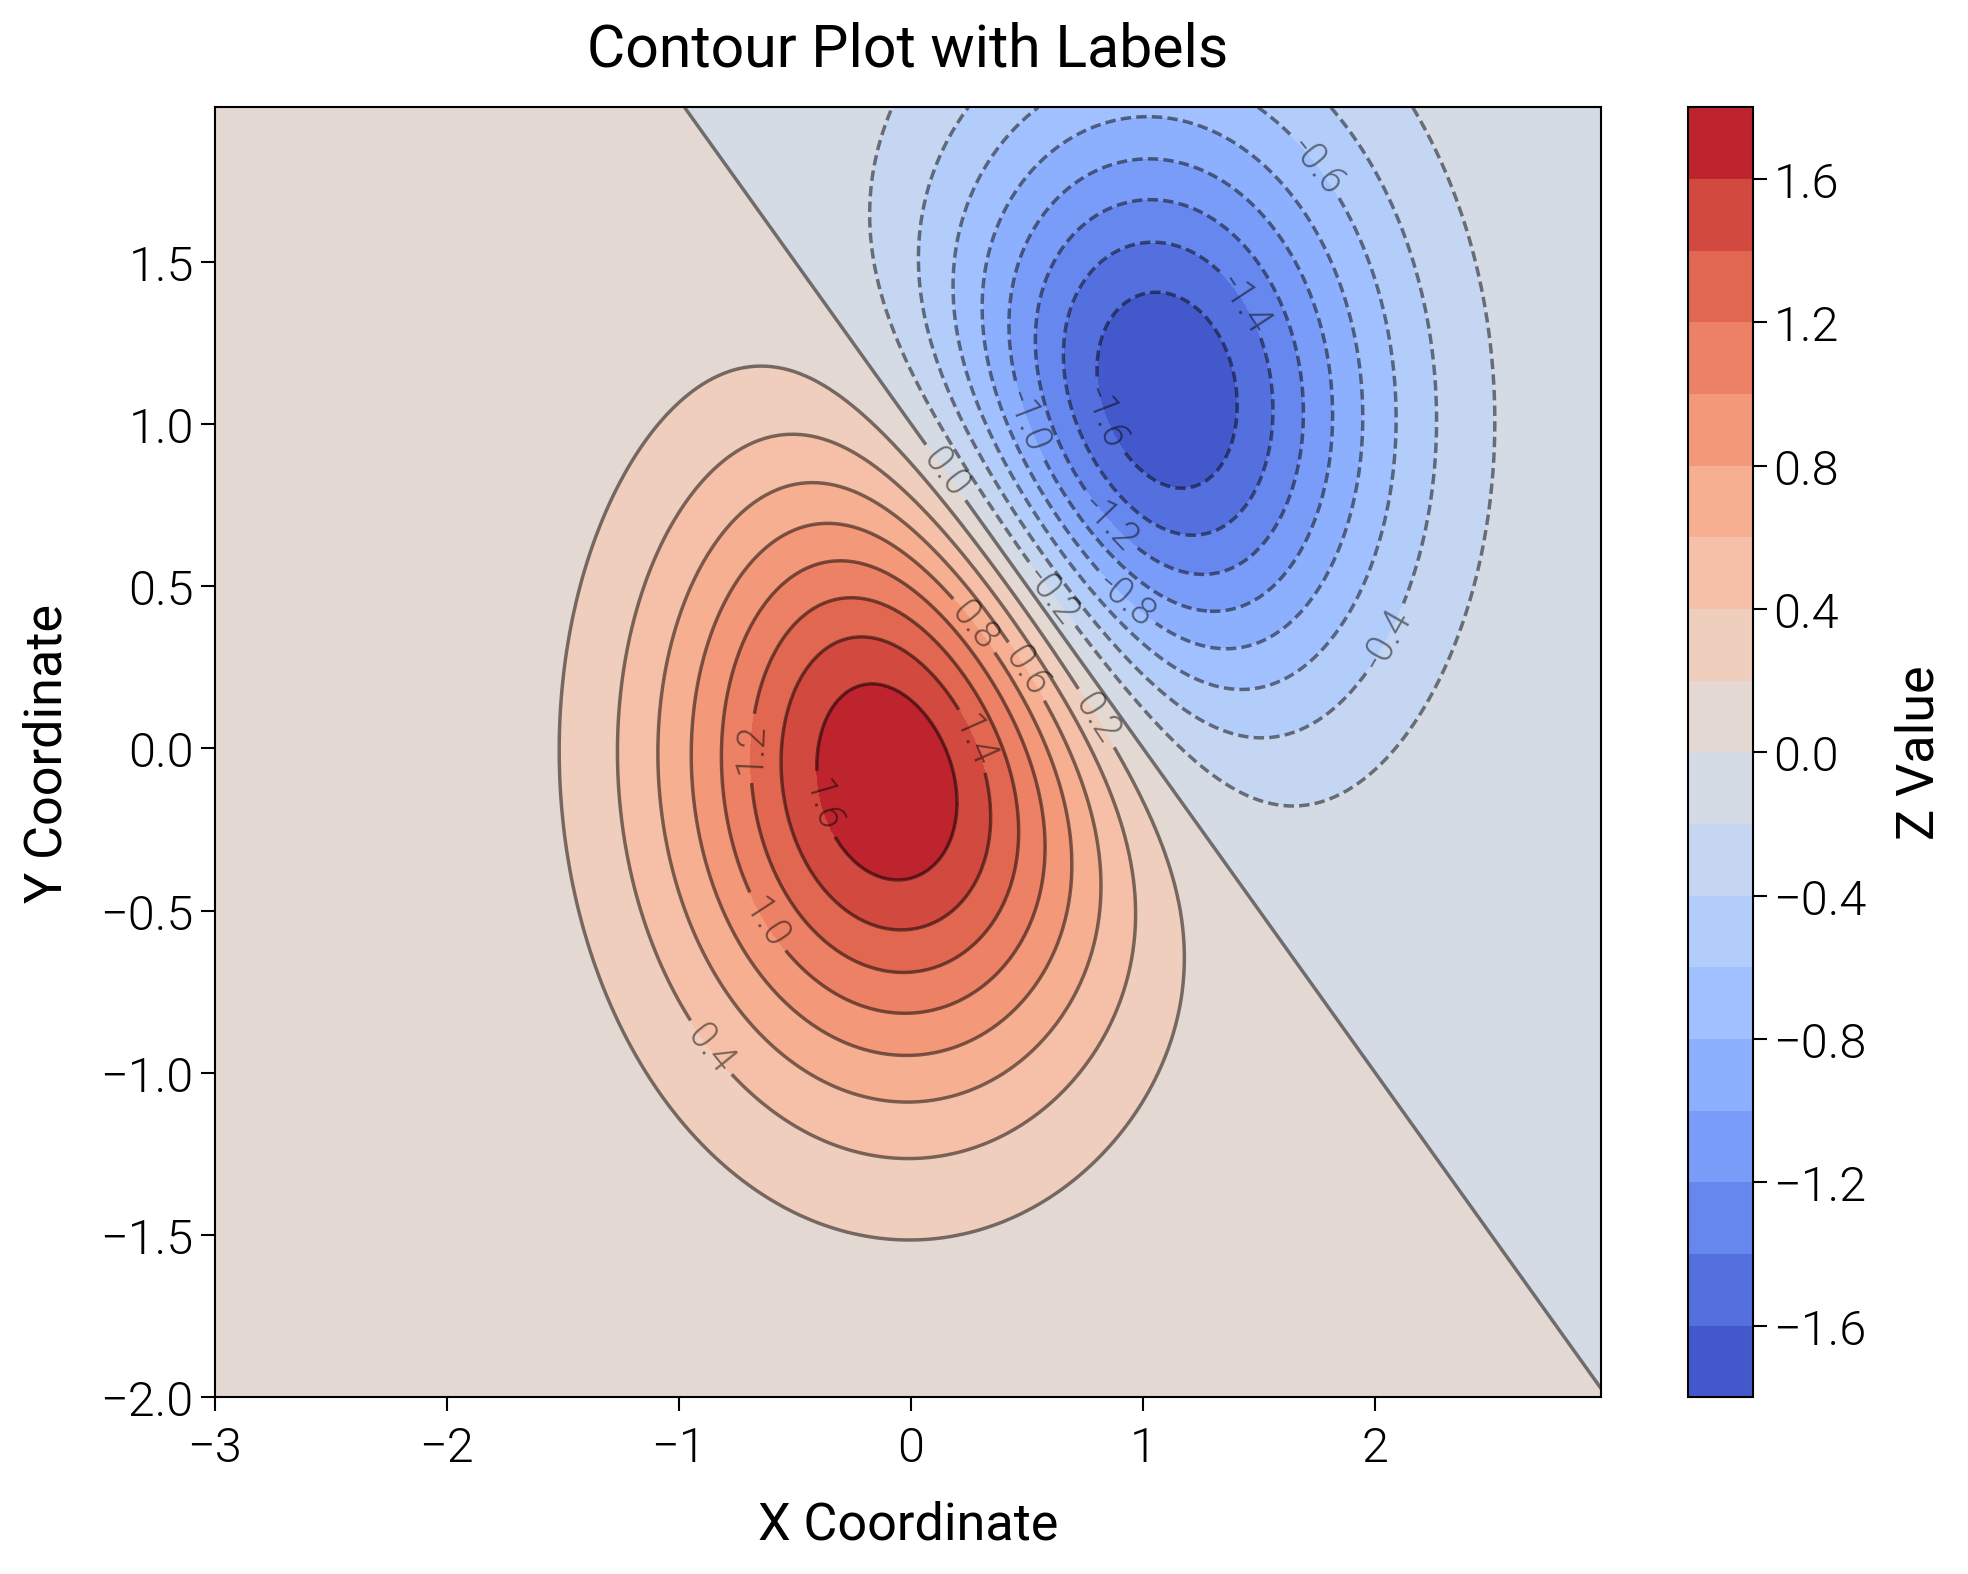
Contour
Filled contour plot of sin(x) cos(y).
Source: dartwork_mpl/asset/prompt/05-templates/contour.py ·
dm.get_prompt("05-templates/contour") · MCP
dartwork-mpl://templates/contour.
# ai-template-meta-start
# use_case: Show a 2D scalar field as level curves
# difficulty: advanced
# data_shape: x: 1D array, y: 1D array, z: 2D array
# tags: contour, 2d-scalar, gridded, isolines
# ai-template-meta-end

import matplotlib.pyplot as plt
import numpy as np

import dartwork_mpl as dm

dm.style.use("scientific")

x = np.linspace(-3, 3, 100)
y = np.linspace(-3, 3, 100)
X, Y = np.meshgrid(x, y)
Z = np.sin(X) * np.cos(Y)

fig, ax = plt.subplots(figsize=dm.figsize("11cm", "square"))
cs = ax.contourf(X, Y, Z, levels=20, cmap="viridis")
fig.colorbar(cs, ax=ax)
ax.set_xlabel("x")
ax.set_ylabel("y")
ax.set_title("sin(x)·cos(y)", fontsize=dm.fs(1), fontweight=dm.fw(1))

dm.simple_layout(fig)
Total running time of the script: (0 minutes 0.499 seconds)