Note
Go to the end to download the full example code.
Violin (Advanced)
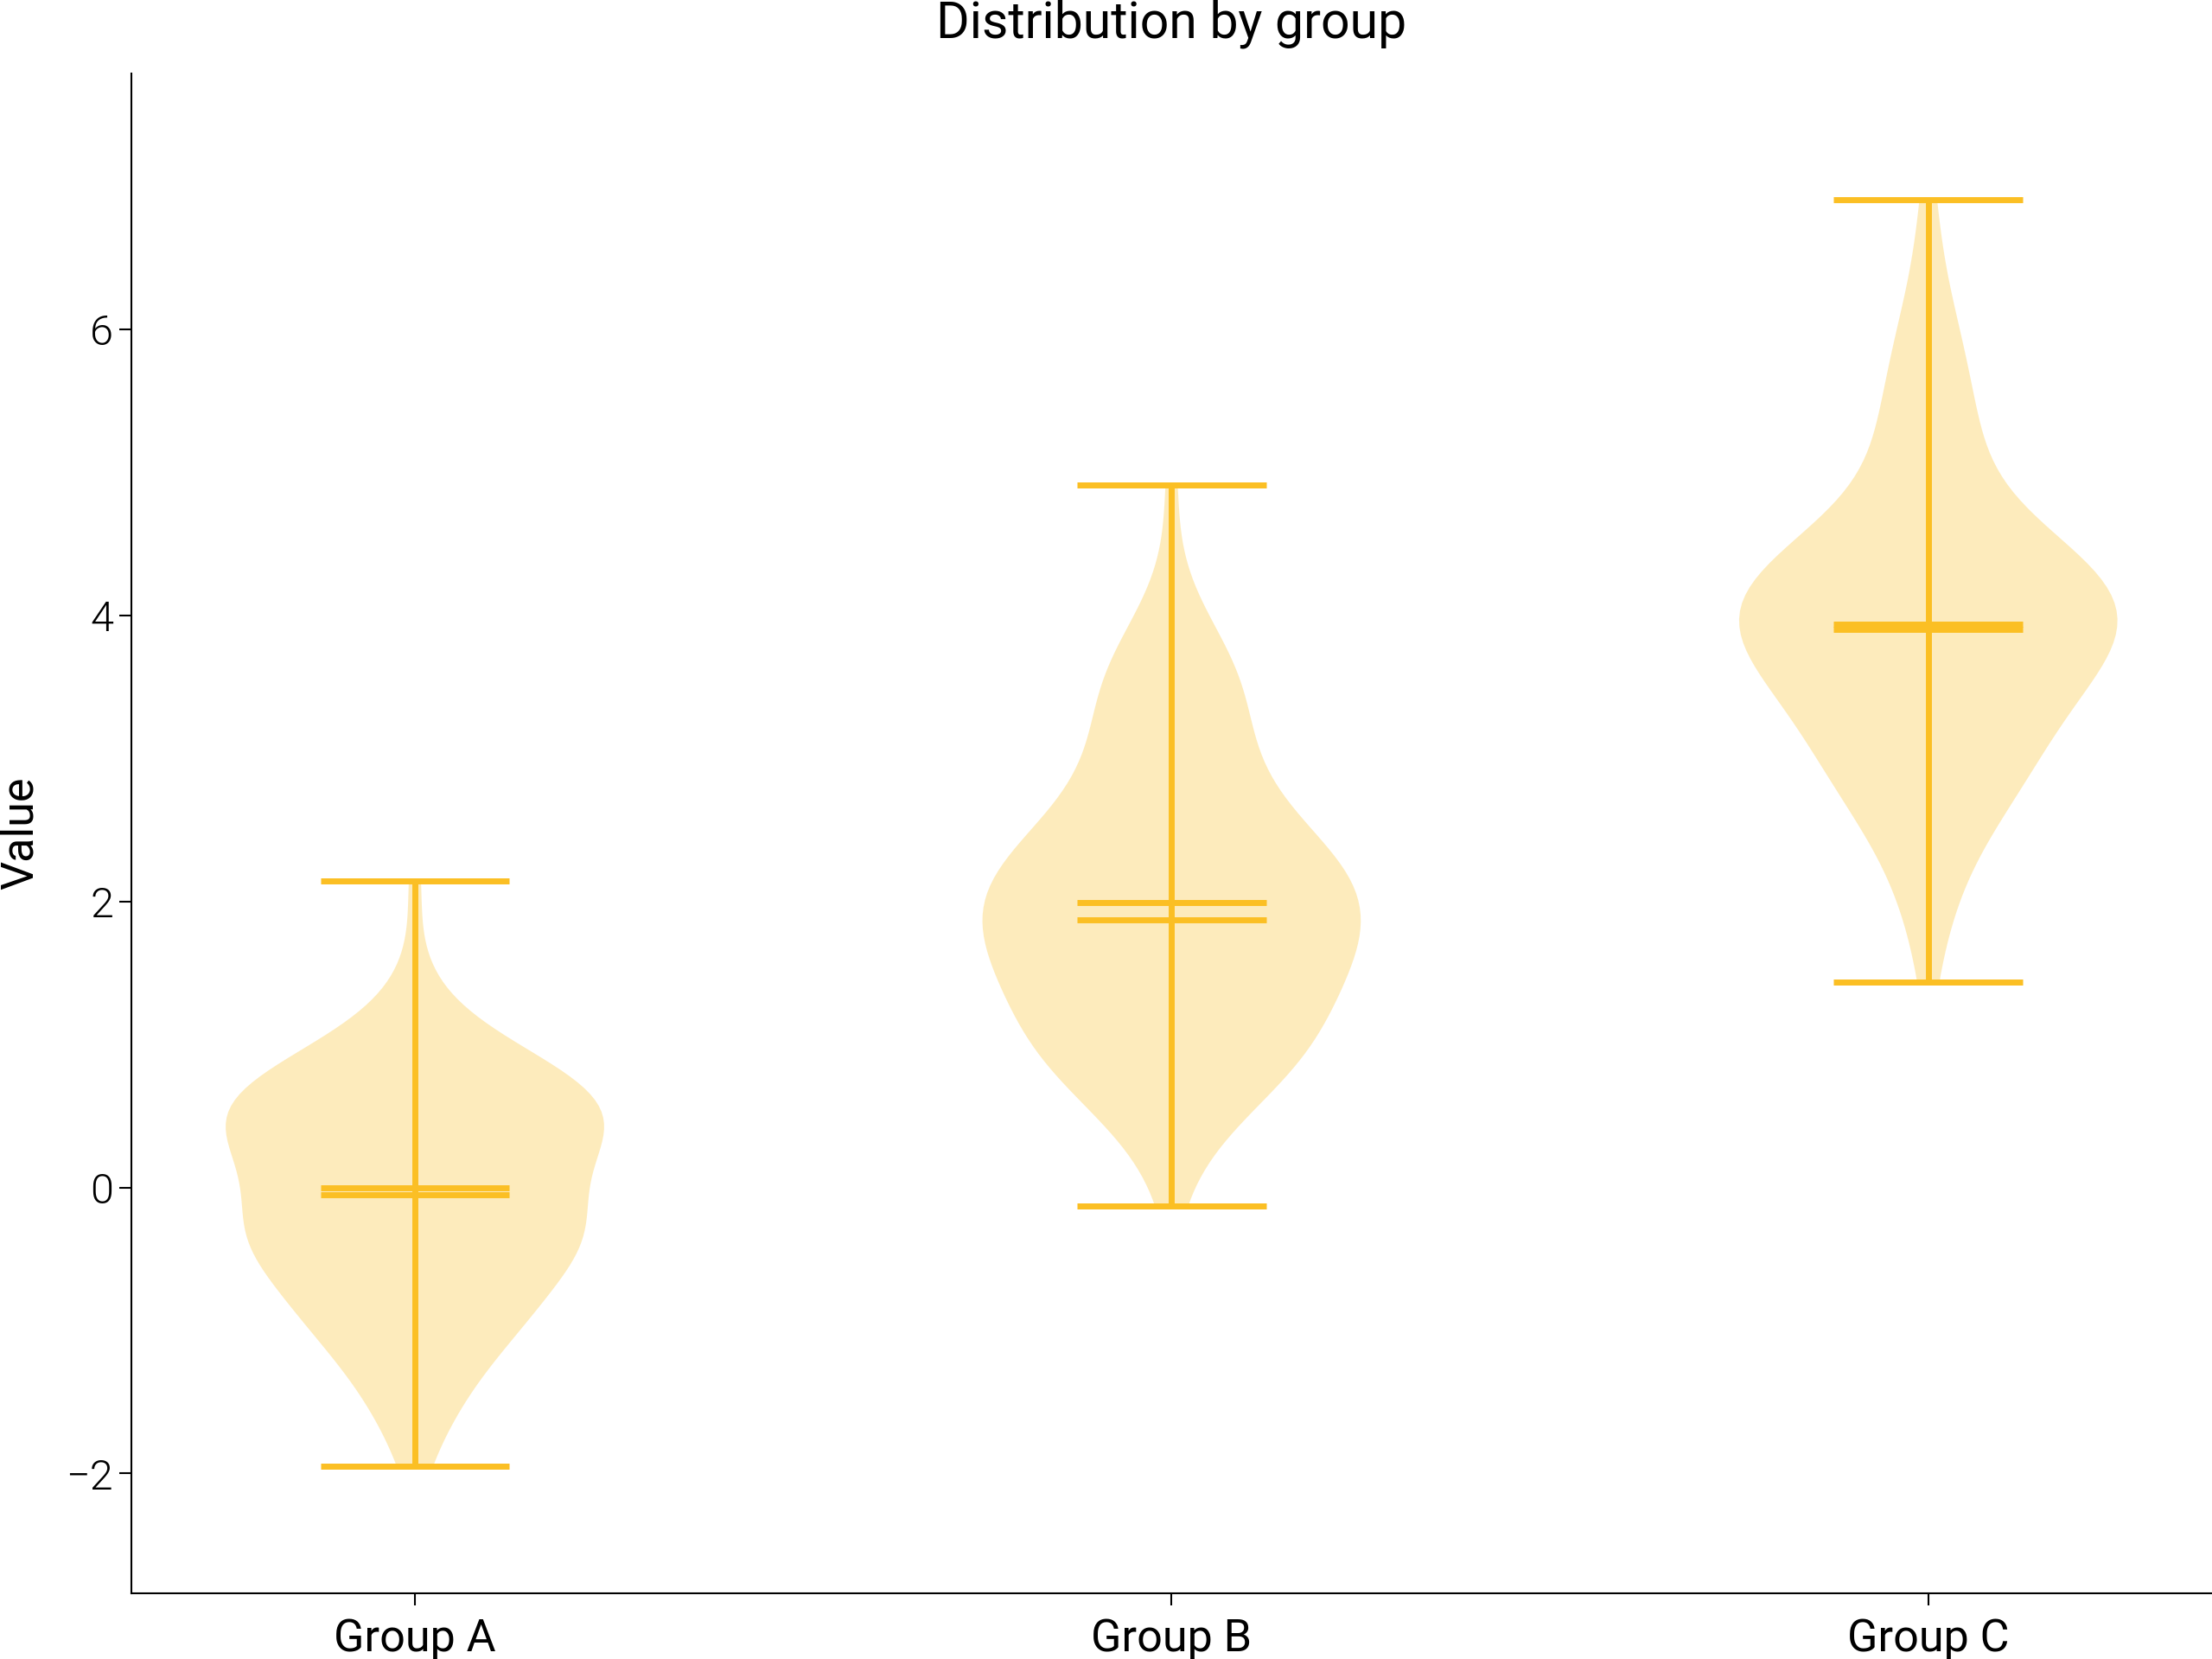
Violin — advanced template (gradient bodies + median/IQR markers).
Source: dartwork_mpl/asset/prompt/05-templates/advanced/violin.py ·
MCP dartwork-mpl://template/advanced/violin.
[VISUAL] 💡 TICK_ROTATION: X-axis[0]: 회전 불필요, rotation=0으로 수평 배치 가능 (max label 183.8px, slot 306.2px)
[VISUAL] 💡 TEXT_CONTRAST: Text contrast 3.32:1 is below the 4.5:1 AA threshold for normal text (sample: 'n = 200 per region — white dot = medi...')
[VISUAL] ⚠️  TEXT_CONTRAST: Text contrast 2.07:1 is below the 4.5:1 AA threshold for normal text (sample: 'Source: synthetic CSAT panel (rng see...')
[VISUAL] 💡 GRAYSCALE_SAFETY: The project modeled-relative-Y proximity heuristic before compositing found source-RGB pairs below its ΔY threshold; inspect ΔEOK separation: #00c897/#54d3aa, #54d3aa/#7dddbd, #7dddbd/#a0e7cf

=== FIX SUGGESTIONS ===

TICK_ROTATION: X-axis[0]: 회전 불필요, rotation=0으로 수평 배치 가능 (max label 183.8px, slot 306.2px)
  Option 1:
    # Adjust x tick label rotation
    dm.rotate_tick_labels(ax, axis='x', rotation=0)
  Option 2:
    # Or reduce tick density
    ax.xaxis.set_major_locator(plt.MaxNLocator(nbins=6))
[VISUAL] 💡 TICK_ROTATION: X-axis[0]: 회전 불필요, rotation=0으로 수평 배치 가능 (max label 183.8px, slot 306.2px)
[VISUAL] 💡 TEXT_CONTRAST: Text contrast 3.32:1 is below the 4.5:1 AA threshold for normal text (sample: 'n = 200 per region — white dot = medi...')
[VISUAL] ⚠️  TEXT_CONTRAST: Text contrast 2.07:1 is below the 4.5:1 AA threshold for normal text (sample: 'Source: synthetic CSAT panel (rng see...')
[VISUAL] 💡 GRAYSCALE_SAFETY: The project modeled-relative-Y proximity heuristic before compositing found source-RGB pairs below its ΔY threshold; inspect ΔEOK separation: #00c897/#54d3aa, #54d3aa/#7dddbd, #7dddbd/#a0e7cf
# ai-template-meta-start
# tier: advanced
# basic_counterpart: violin
# use_case: Distribution shape across 5 groups with median + IQR markers and gradient bodies
# difficulty: intermediate
# data_shape: groups: dict[str, list[float]]
# tags: violin, distribution, quartiles, gradient, narrative
# narrative: Customer satisfaction score by region; widest spread in APAC
# advanced_apis: violinplot with custom face colors via dm.cspace, median + p25/p75 dots, ax.set_xticklabels with rotation
# ai-template-meta-end

import matplotlib.pyplot as plt
import numpy as np

import dartwork_mpl as dm

dm.style.use("scientific")

rng = np.random.default_rng(42)
groups = {
    "North America": rng.normal(78, 6, 200),
    "EMEA": rng.normal(74, 7, 200),
    "LATAM": rng.normal(70, 8, 200),
    "APAC": rng.normal(72, 11, 200),
    "MEA": rng.normal(68, 9, 200),
}
labels = list(groups.keys())
data = [groups[k] for k in labels]
medians = [float(np.median(g)) for g in data]
p25s = [float(np.percentile(g, 25)) for g in data]
p75s = [float(np.percentile(g, 75)) for g in data]

gradient = dm.cspace("dc.teal5", "dc.teal1", n=len(labels))
colors = [c.to_hex() for c in gradient]

fig, ax = plt.subplots(figsize=dm.figsize("14.5cm", "standard"))

parts = ax.violinplot(
    data, showmeans=False, showmedians=False, showextrema=False, widths=0.65
)
for body, color in zip(parts["bodies"], colors, strict=False):
    body.set_facecolor(color)
    body.set_edgecolor("oc.gray7")
    body.set_alpha(0.85)
    body.set_linewidth(0.3)

# Median dots + p25/p75 dots overlaid.
xs = np.arange(1, len(labels) + 1)
ax.scatter(
    xs,
    medians,
    s=40,
    color="white",
    edgecolor="oc.gray9",
    linewidth=0.5,
    zorder=5,
    label="Median",
)
ax.scatter(xs, p25s, s=14, color="oc.gray9", marker="_", zorder=4)
ax.scatter(xs, p75s, s=14, color="oc.gray9", marker="_", zorder=4)
for i, m in enumerate(medians):
    ax.text(
        xs[i] + 0.18,
        m,
        f"{m:.0f}",
        va="center",
        ha="left",
        fontsize=dm.fs(-1),
        color="oc.gray8",
    )

ax.set_xticks(xs)
ax.set_xticklabels(labels, rotation=20, ha="right")
ax.set_ylabel("CSAT score (0-100)")
ax.set_xlabel("Region")
ax.set_ylim(40, 105)
ax.legend(loc="lower right", fontsize=dm.fs(-1), frameon=False)

ax.set_title(
    "APAC carries the widest CSAT spread despite a middling median",
    fontsize=dm.fs(1),
    fontweight=dm.fw(1),
    loc="left",
    pad=18,
)
ax.text(
    0.0,
    1.02,
    "n = 200 per region — white dot = median, ticks = 25/75 percentiles.",
    transform=ax.transAxes,
    ha="left",
    va="bottom",
    fontsize=dm.fs(-1),
    color="oc.gray6",
)

fig.text(
    0.01,
    0.005,
    "Source: synthetic CSAT panel (rng seed 42).",
    fontsize=dm.fs(-2),
    color="oc.gray5",
    ha="left",
    va="bottom",
)

dm.simple_layout(fig, margin=dm.inch(0.12))
dm.validate_with_fixes(fig)

issues = dm.check_figure_quality(fig)
issues = [i for i in issues if "No data" not in i]
if issues:
    print(f"[violin-advanced] quality issues: {issues}")

dm.save_formats(fig, "violin_advanced")
Total running time of the script: (0 minutes 0.639 seconds)