Note
Go to the end to download the full example code.
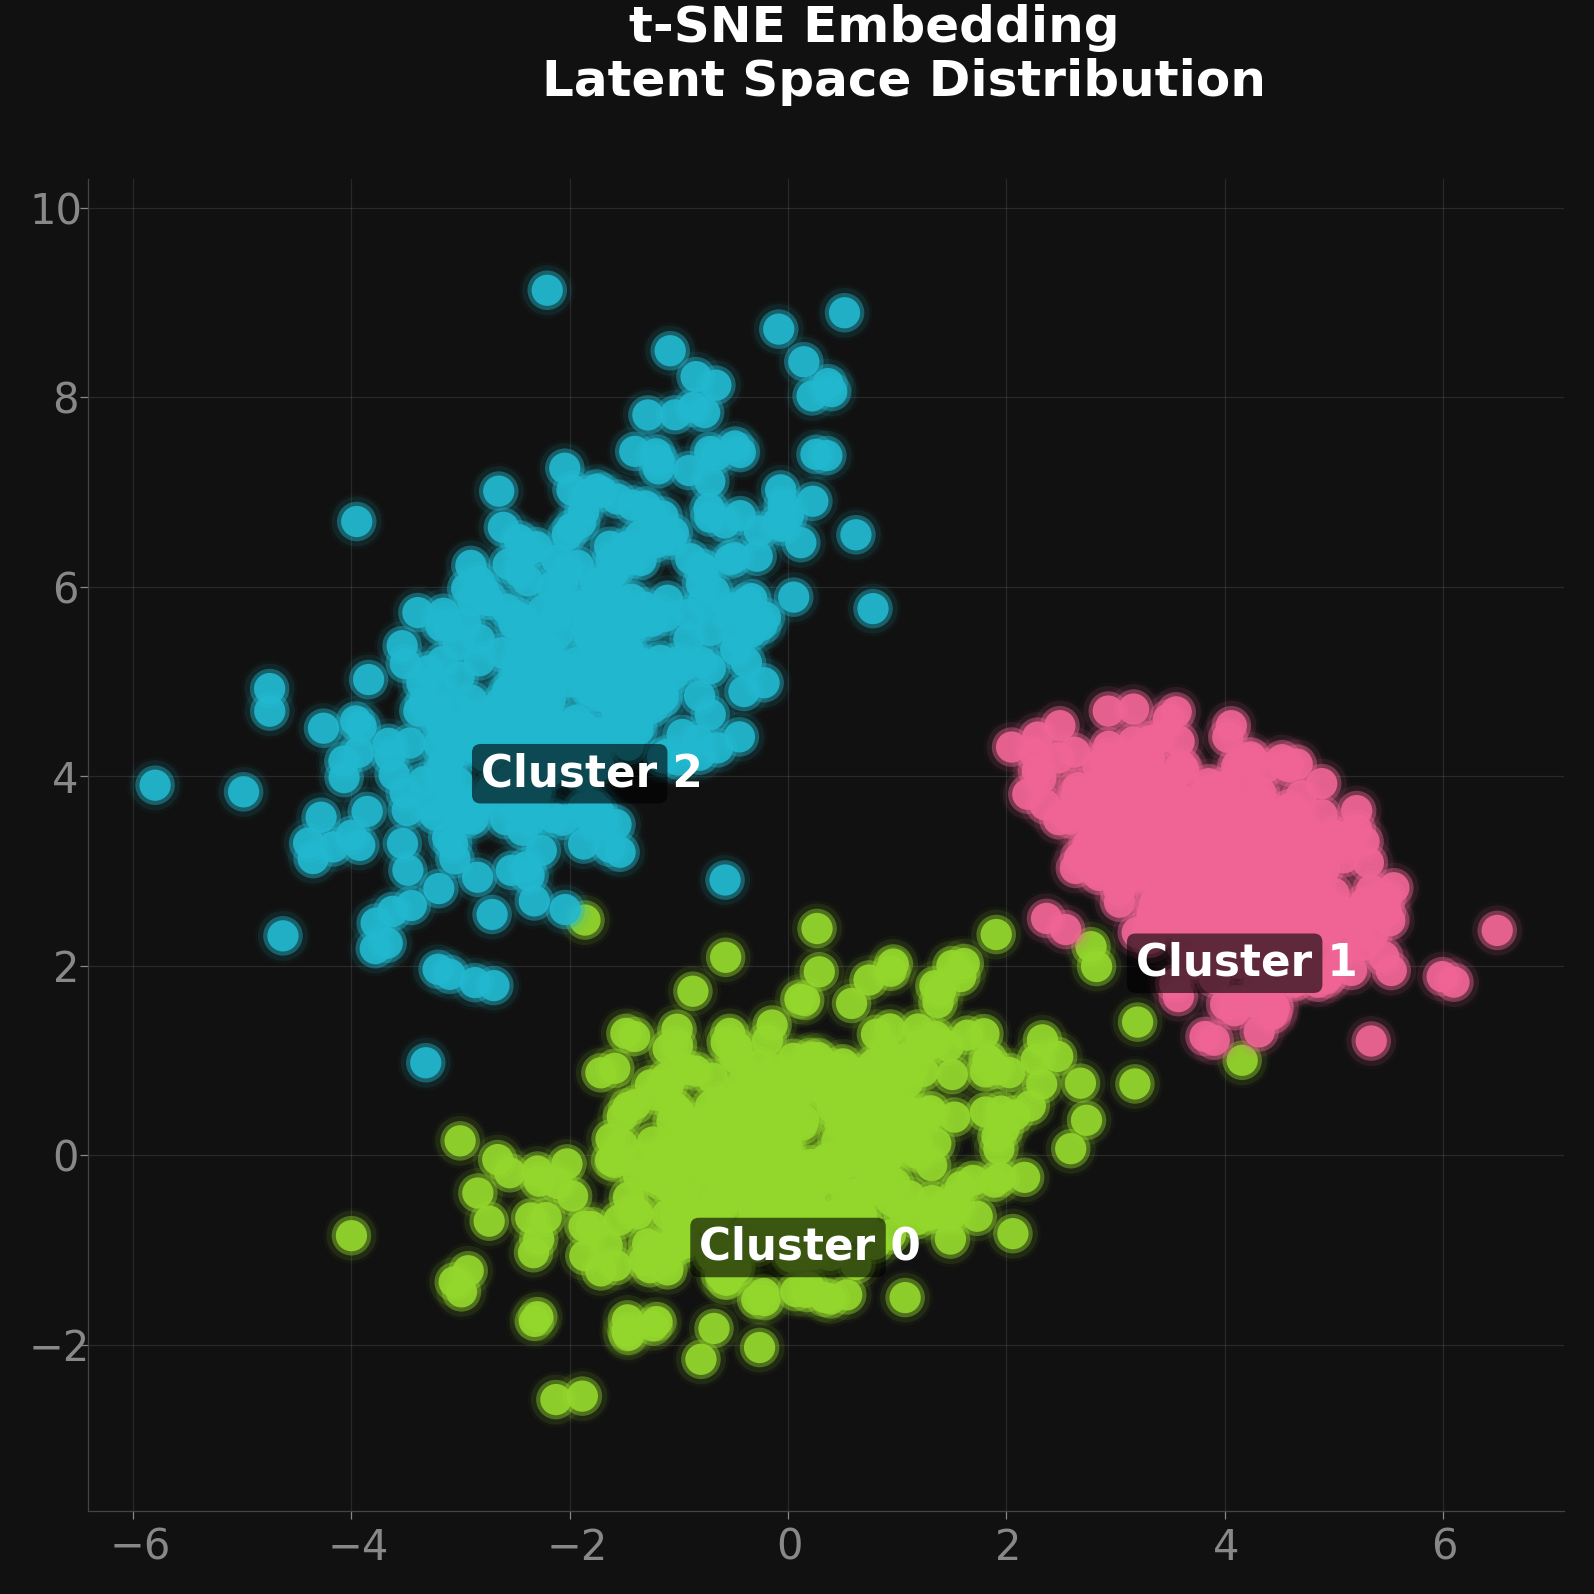
Glowing Dark Mode t-SNE / GMM Clusters
A demonstration of styling a scatter plot for high-impact machine learning
visualizations (like t-SNE, UMAP, or GMM clusters). By combining Matplotlib’s
built-in dark_background style context with dartwork-mpl’s dynamic
colors and layered alpha blending, we achieve a striking “neon glow” effect
without complex shader logic.
import matplotlib.pyplot as plt
import numpy as np

import dartwork_mpl as dm

# Layer matplotlib's dark_background under dartwork-mpl's presentation
# sizing. Order matters: the context sets the dark palette first, then
# dm.style.use("presentation") overlays the typography/sizing (its lighter
# facecolor defaults are explicitly re-darkened below with set_facecolor).
# dm.style.use mutates the global rcParams, not the context — that is why
# the whole figure is built inside this block while both are active.
with plt.style.context("dark_background"):
    dm.style.use("presentation")

    # Generate synthetic clustered data
    np.random.seed(42)
    n_samples = 400

    centers = [[0, 0], [4, 3], [-2, 5]]
    covs = [
        [[1.5, 0.4], [0.4, 0.8]],
        [[0.6, -0.3], [-0.3, 0.5]],
        [[1.2, 0.8], [0.8, 1.8]],
    ]

    cluster_colors = ["dc.pop2", "dc.vivid2", "dc.ocean2"]

    fig, ax = plt.subplots(figsize=dm.figsize("13.5cm", "square"))
    fig.patch.set_facecolor("#111111")
    ax.set_facecolor("#111111")

    # We create a "glow" effect by plotting the same points multiple times
    # with increasing size and decreasing opacity (alpha)
    glow_layers = [
        (dm.fs(3) ** 2, 0.03),  # Large faint glow
        (dm.fs(1.5) ** 2, 0.1),  # Medium glow
        (dm.fs(-1) ** 2, 0.4),  # Inner core
        (dm.fs(-3) ** 2, 0.9),  # Bright center pin
    ]

    for i, (center, cov, color_name) in enumerate(
        zip(centers, covs, cluster_colors, strict=False)
    ):
        points = np.random.multivariate_normal(center, cov, n_samples)
        x, y = points[:, 0], points[:, 1]

        core_hex = dm.color(color_name).to_hex()

        for s, alpha in glow_layers:
            ax.scatter(
                x,
                y,
                s=s,
                color=core_hex,
                alpha=alpha,
                edgecolors="none",
                zorder=2,
            )

        # Add a subtle label near the center
        ax.annotate(
            f"Cluster {i}",
            xy=center,
            xytext=(0, -25),
            textcoords="offset points",
            ha="center",
            fontsize=dm.fs(0),
            weight="bold",
            color="white",
            bbox={
                "boxstyle": "round,pad=0.2",
                "fc": "black",
                "ec": "none",
                "alpha": 0.6,
            },
        )

    # Tweak aesthetics for the dark theme
    ax.grid(True, color="white", alpha=0.1, zorder=0)
    ax.spines["top"].set_visible(False)
    ax.spines["right"].set_visible(False)
    ax.spines["bottom"].set_color("#444444")
    ax.spines["left"].set_color("#444444")
    ax.tick_params(colors="#888888")

    ax.set_title(
        "t-SNE Embedding\nLatent Space Distribution",
        color="white",
        fontsize=dm.fs(1.5),
        weight="bold",
        pad=20,
        ha="center",
    )

    dm.simple_layout(fig)
plt.show()
Total running time of the script: (0 minutes 1.400 seconds)