Note
Go to the end to download the full example code.
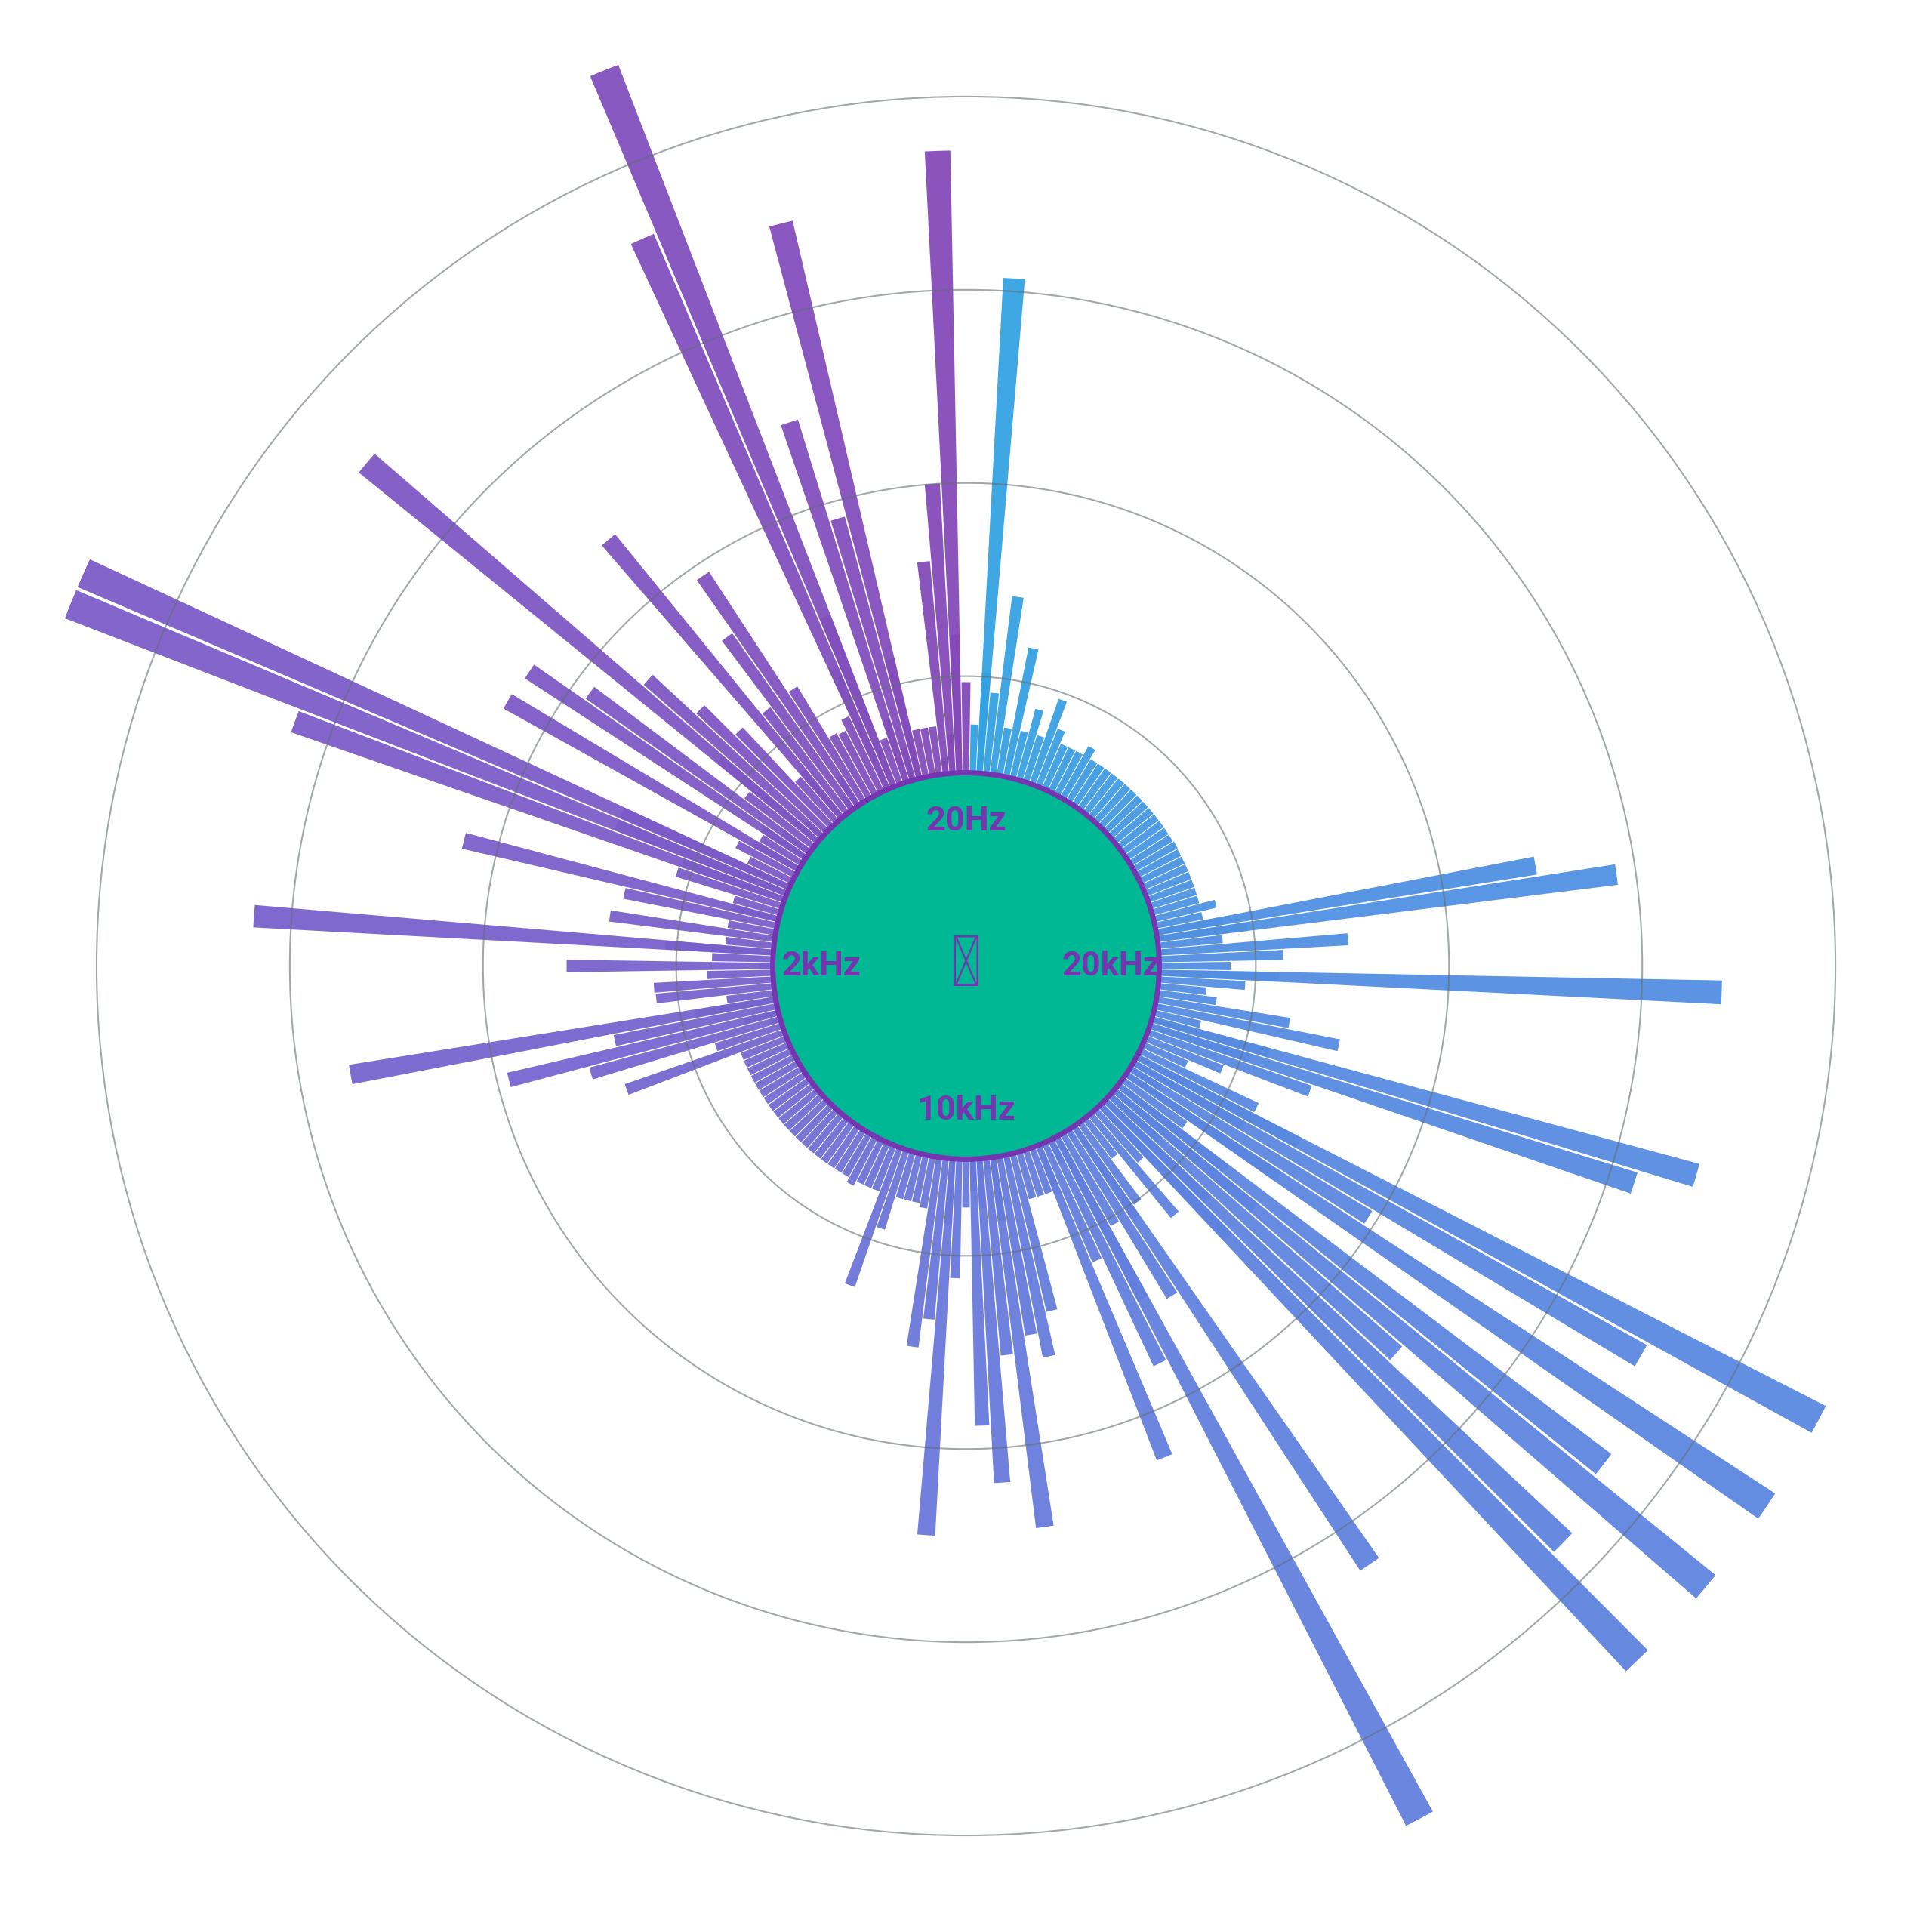
Circular Audio Spectrum Visualizer
A radial spectrum analyzer built with polar bars. Each bar carries a colour from a 180-step OKLCH gradient, plus a faded reflection bar behind it for depth. Concentric guide rings and frequency labels round out the look of an audio interface.
This example is a tour of polar tricks:
Drawing rectangles via
ax.bar(angle, freq, width=...).Embedding a cartesian
plt.Circleon a polar axes throughtransform=ax.transData._b.Mapping bar colour from
dm.cspace(..., space="oklch").
import matplotlib.pyplot as plt
import numpy as np

import dartwork_mpl as dm

np.random.seed(42)
dm.style.use("scientific")

fig, ax = plt.subplots(
    figsize=dm.figsize("13cm", "square"), subplot_kw={"projection": "polar"}
)

n_frequencies = 180
frequencies = np.random.exponential(2, n_frequencies) * (
    1 + np.sin(np.linspace(0, 4 * np.pi, n_frequencies))
)
frequencies = np.clip(frequencies, 0.5, 8)

theta = np.linspace(0, 2 * np.pi, n_frequencies, endpoint=False)
colors = dm.cspace("oc.purple9", "dc.teal1", n=n_frequencies, space="oklch")

bar_width = 2 * np.pi / n_frequencies * 0.9
for angle, freq, color in zip(theta, frequencies, colors, strict=False):
    ax.bar(
        angle,
        freq,
        width=bar_width,
        bottom=2,
        color=color.to_hex(),
        alpha=0.85,
        edgecolor="none",
    )
    ax.bar(
        angle,
        freq * 0.3,
        width=bar_width,
        bottom=1.5,
        color=color.to_hex(),
        alpha=0.3,
        edgecolor="none",
    )

# Center disk
center = plt.Circle(
    (0, 0),
    2,
    transform=ax.transData._b,
    facecolor="dc.indigo1",
    edgecolor="oc.purple9",
    linewidth=dm.lw(0),
)
ax.add_patch(center)

for angle, label in [
    (0, "20Hz"),
    (np.pi / 2, "2kHz"),
    (np.pi, "10kHz"),
    (3 * np.pi / 2, "20kHz"),
]:
    ax.text(
        angle,
        1.5,
        label,
        ha="center",
        va="center",
        fontsize=dm.fs(-1),
        color="oc.purple9",
        weight="bold",
    )

for r in [3, 5, 7, 9]:
    ax.add_patch(
        plt.Circle(
            (0, 0),
            r,
            transform=ax.transData._b,
            fill=False,
            edgecolor="dc.indigo4",
            linewidth=0.3,
            alpha=0.6,
        )
    )

ax.set_ylim(0, 10)
ax.set_theta_zero_location("N")
ax.set_theta_direction(1)
for s in ax.spines.values():
    s.set_visible(False)
ax.set_xticks([])
ax.set_yticks([])

ax.text(
    0,
    0,
    "♪",
    fontsize=dm.fs(6),
    ha="center",
    va="center",
    color="oc.purple9",
    weight="bold",
)

dm.simple_layout(fig)
plt.show()
Total running time of the script: (0 minutes 1.227 seconds)