Note
Go to the end to download the full example code.
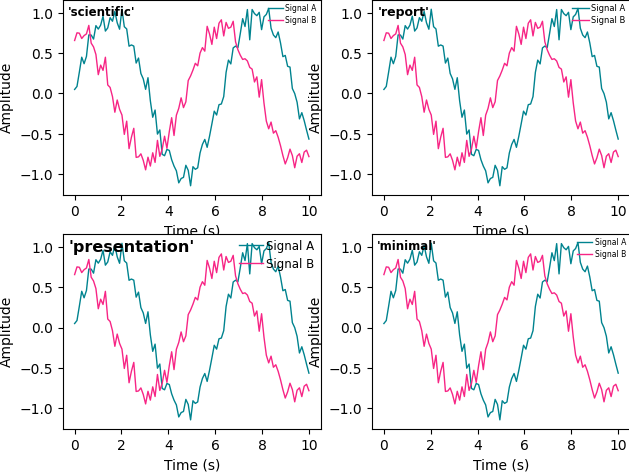
Style Presets: Side-by-Side Comparison
The four built-in presets — scientific, report, presentation,
and minimal — each tune font sizes, spine weights, and tick density
for a different rendering context. The differences only become obvious
when the same data is drawn under each preset, so this gallery entry
puts them in a 2×2 grid for direct comparison.
Pick the preset that matches the destination of the figure:
scientific— journal / LaTeX articles (moderate fonts, thin spines)report— business reports at A4 page size (balanced spine weights)presentation— projected slides (bold typography, thick lines)minimal— landing pages / explanatory diagrams (chromeless)
Each panel below is rendered through dm.style.use(preset) inside a
context manager (dm.style.context) so the presets do not leak into
later examples.
import matplotlib.pyplot as plt
import numpy as np

import dartwork_mpl as dm

PRESETS = ["scientific", "report", "presentation", "minimal"]

np.random.seed(42)
x = np.linspace(0, 10, 100)
y1 = np.sin(x) + np.random.normal(0, 0.1, 100)
y2 = np.cos(x) * 0.8 + np.random.normal(0, 0.1, 100)

fig, axes = plt.subplots(2, 2, figsize=dm.figsize("16cm", "standard"))

for ax, preset in zip(axes.flat, PRESETS, strict=False):
    with dm.style.context(preset):
        ax.plot(x, y1, label="Signal A", color="dc.teal2", lw=dm.lw(0))
        ax.plot(x, y2, label="Signal B", color="dc.violet2", lw=dm.lw(0))
        ax.set_xlabel("Time (s)")
        ax.set_ylabel("Amplitude")
        ax.legend(loc="upper right", fontsize=dm.fs(-2))
        ax.text(
            0.02,
            0.97,
            f"'{preset}'",
            transform=ax.transAxes,
            ha="left",
            va="top",
            fontsize=dm.fs(1),
            fontweight="bold",
        )

dm.simple_layout(fig)
plt.show()
Total running time of the script: (0 minutes 0.542 seconds)