Note
Go to the end to download the full example code.
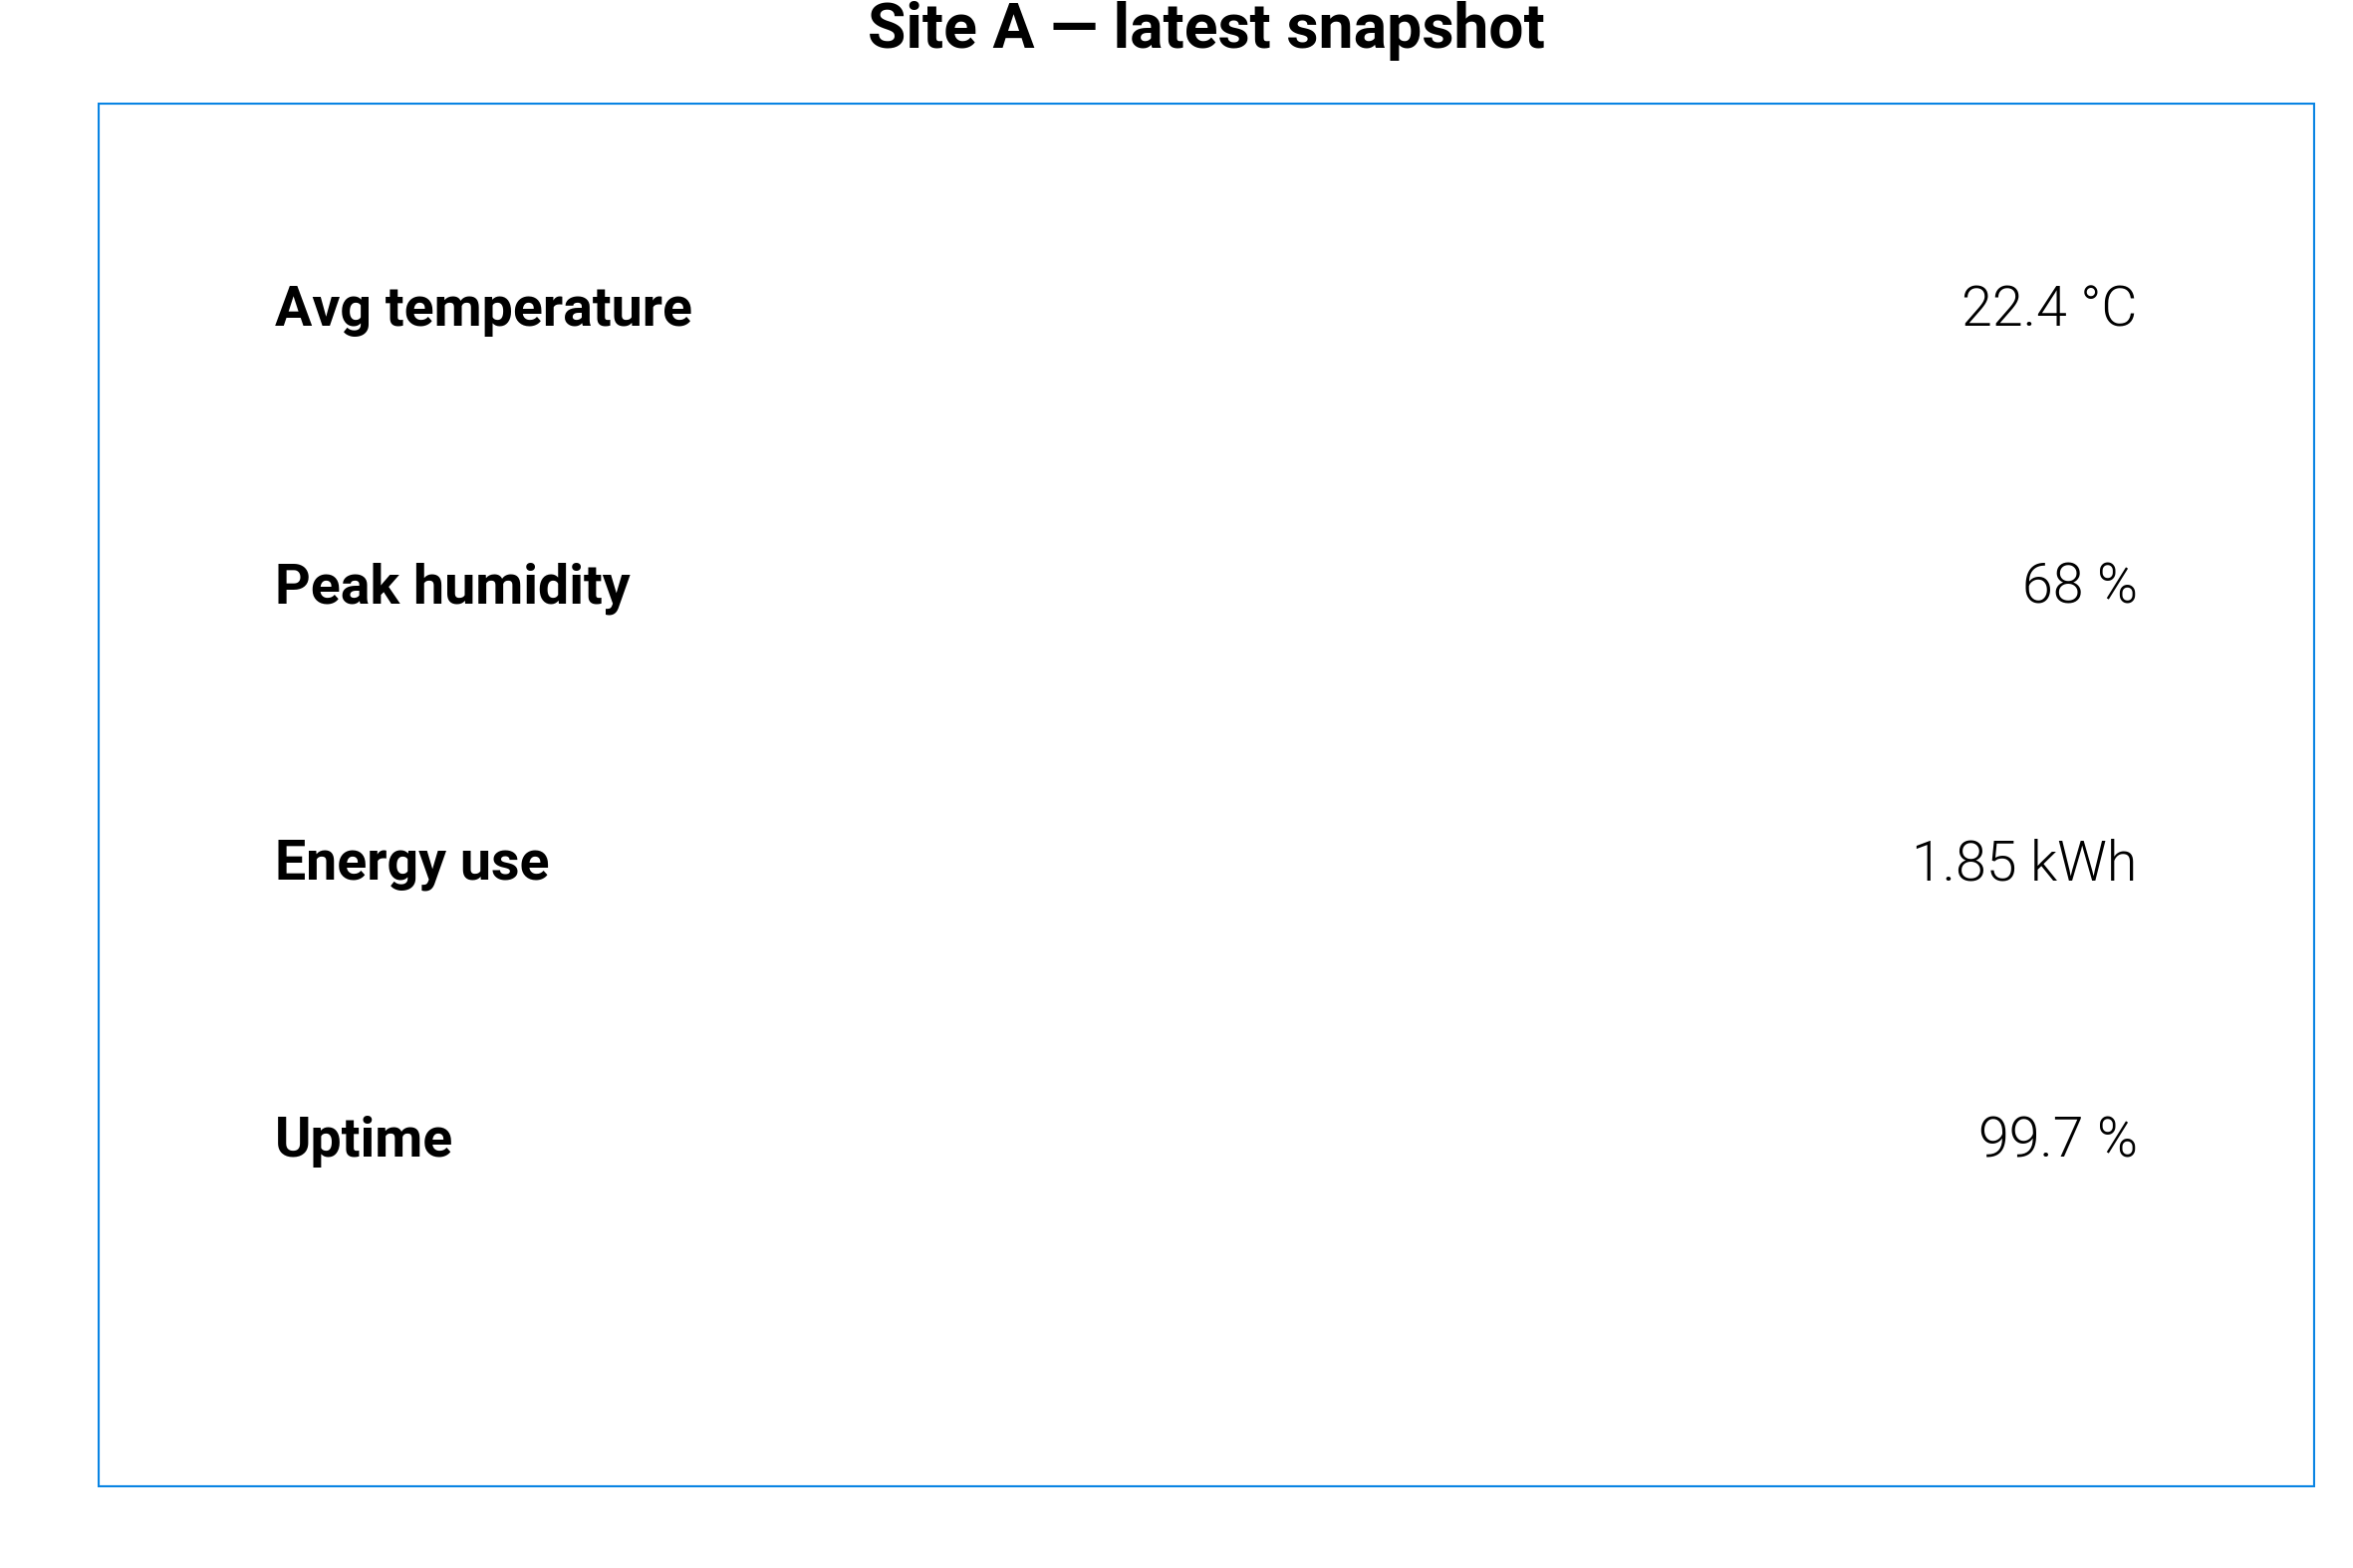
Sensor KPI summary card (text-only)
A label-and-value summary tile rendered with axis("off") and
ax.text. Useful as a building block for dashboards where a compact
numeric snapshot sits alongside charts.
dartwork-mpl’s relative typography (dm.fs(n)) is used so that the
tile rescales cleanly with the surrounding preset.
import matplotlib.pyplot as plt

import dartwork_mpl as dm

dm.style.use("report")

metrics = [
    ("Avg temperature", "22.4 °C"),
    ("Peak humidity", "68 %"),
    ("Energy use", "1.85 kWh"),
    ("Uptime", "99.7 %"),
]

fig = plt.figure(figsize=dm.figsize("12cm", "wide"))
gs = fig.add_gridspec(1, 1, left=0.08, right=0.92, top=0.88, bottom=0.08)
ax = fig.add_subplot(gs[0, 0])
ax.set_axis_off()
ax.add_patch(
    plt.Rectangle(
        (0, 0), 1, 1, fill=False, edgecolor="dc.indigo2", linewidth=0.6
    )
)

y = 0.85
step = 0.2
for label, value in metrics:
    ax.text(
        0.08, y, label, fontsize=dm.fs(0), weight="bold", ha="left", va="center"
    )
    ax.text(0.92, y, value, fontsize=dm.fs(0), ha="right", va="center")
    y -= step

ax.set_title(
    "Site A — latest snapshot", fontsize=dm.fs(1), weight="bold", pad=8
)

dm.simple_layout(fig)
plt.show()
Total running time of the script: (0 minutes 0.254 seconds)