Note
Go to the end to download the full example code.
helpers.quality — Figure Quality Checks and Chart-Type Suggestion
dm.helpers.quality.check_figure_quality inspects a figure for
rendering gotchas — hairline strokes, microscopic markers, tiny
titles, overlapping annotations — and returns a list of human-readable
issues. suggest_chart_type separately maps an abstract data shape
(axis kinds, point count, series count) to a sensible chart
recommendation.
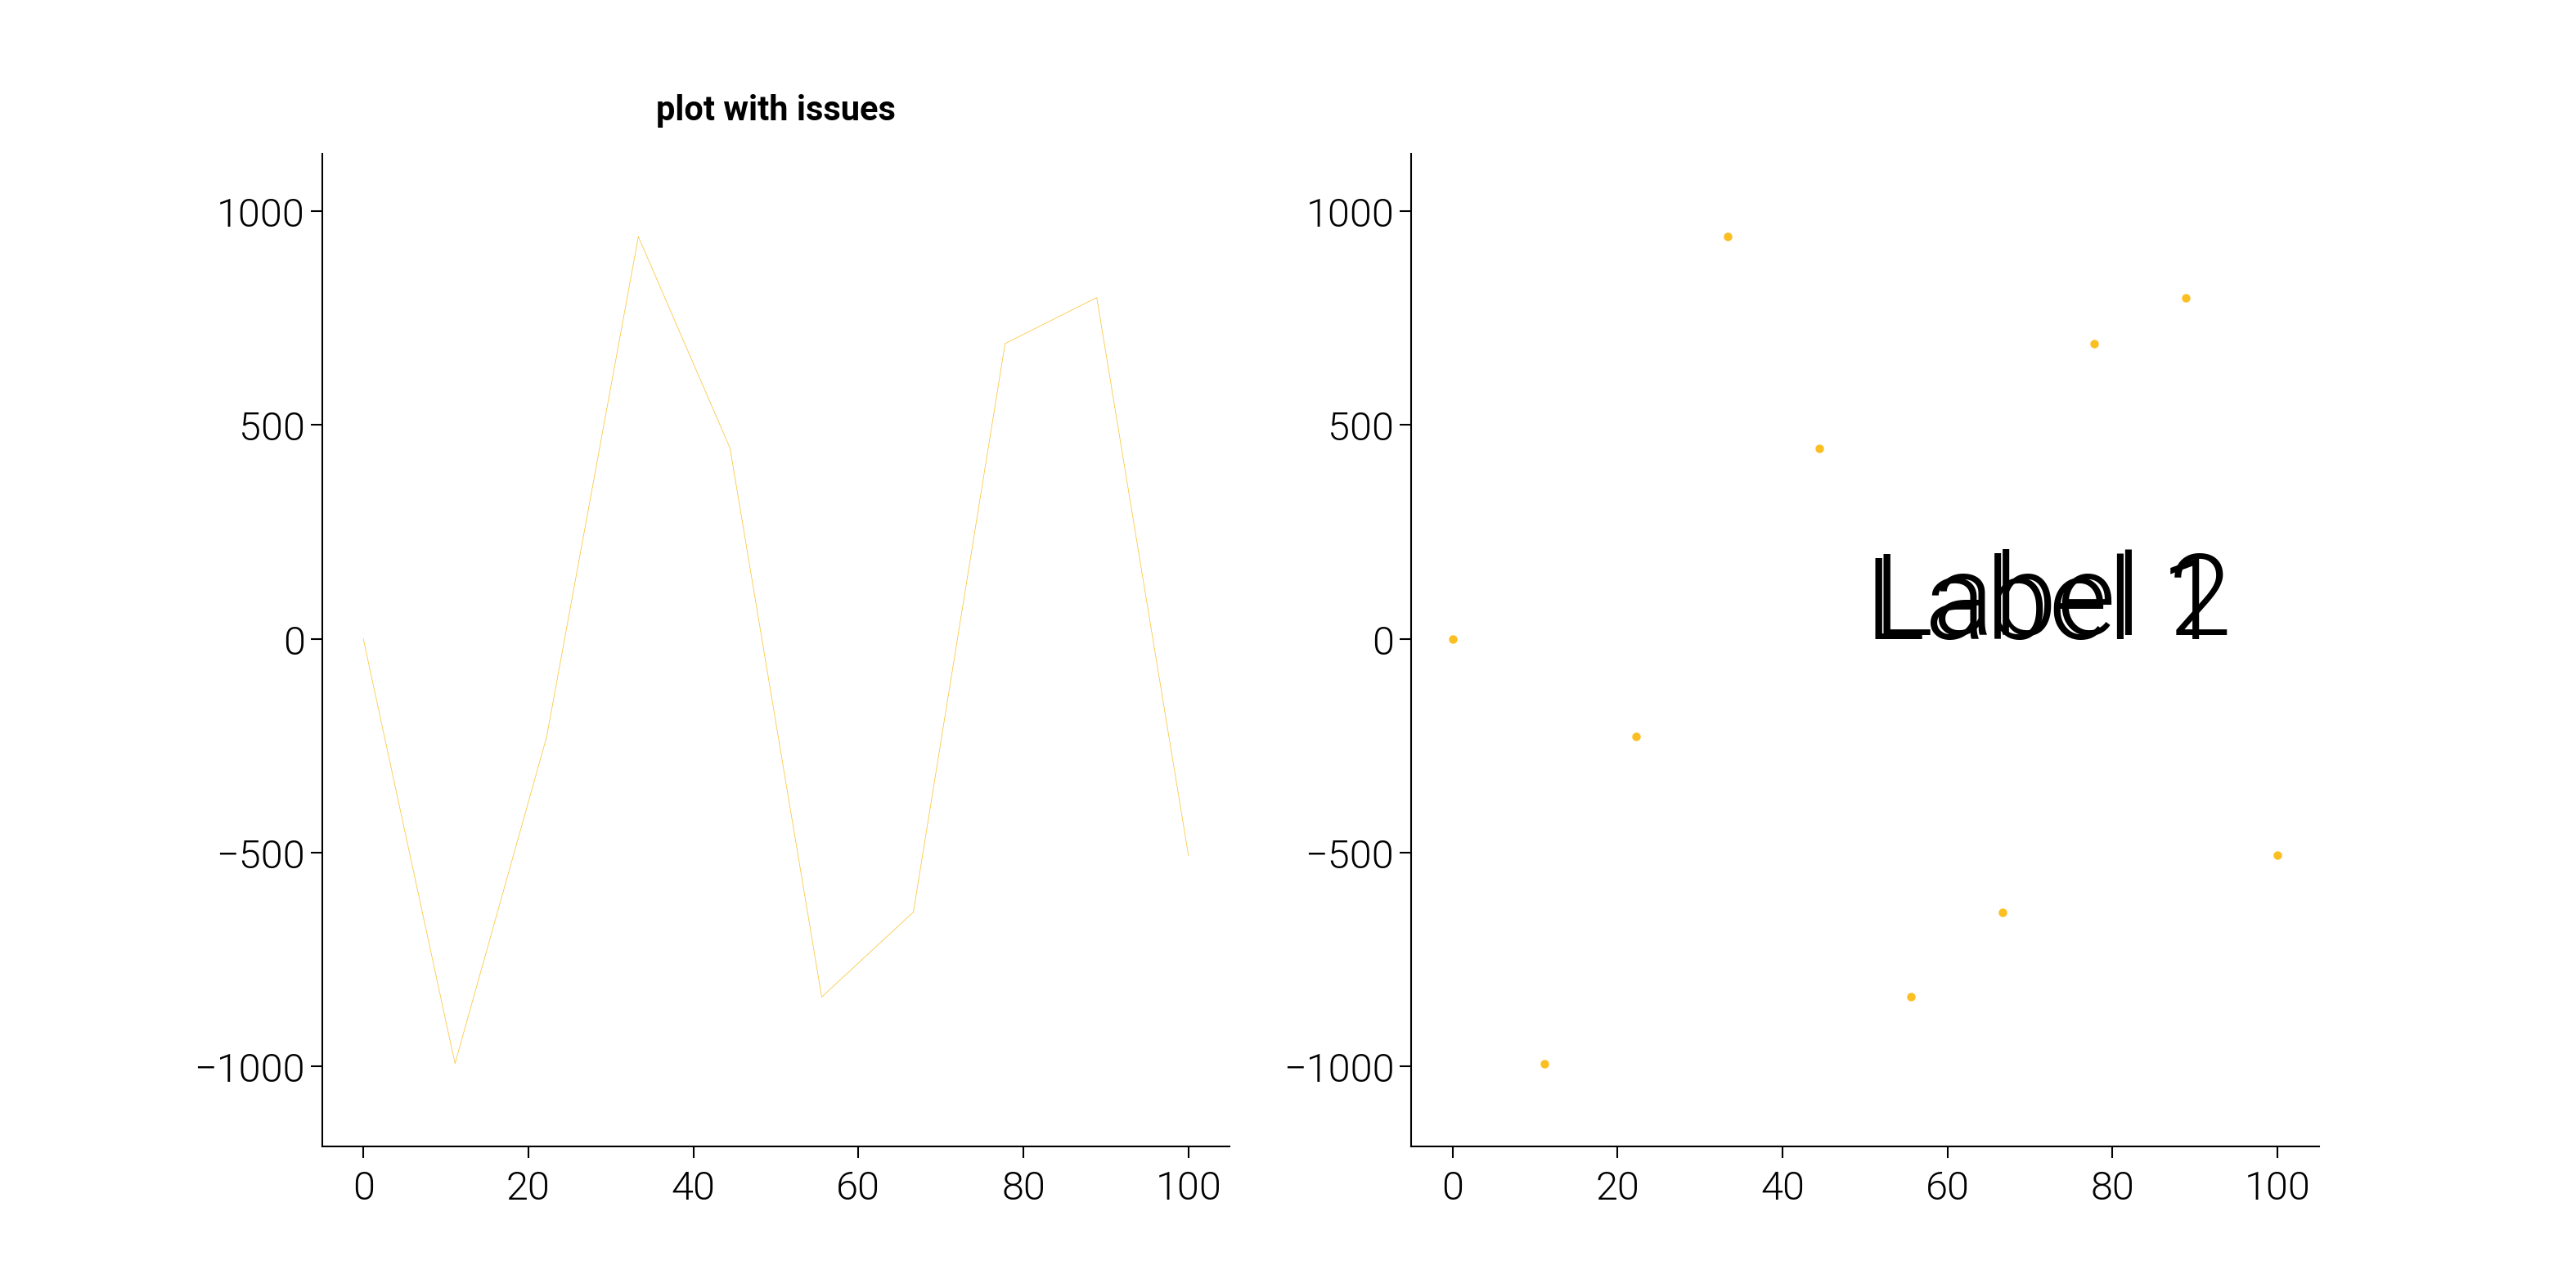
The figure below is deliberately built with several quality issues so the check yields something interesting; the script then prints the issue list and a few chart-type suggestions for common data shapes.
Quality Check Results
==================================================
1. Axes 0: Missing x-axis label
2. Axes 0: Missing y-axis label
3. Axes 1: Missing x-axis label
4. Axes 1: Missing y-axis label

Chart Type Suggestions
==================================================
Categorical data: bar
Time series: line
Correlation data: scatter_density
Single categorical: count_bar
import matplotlib.pyplot as plt
import numpy as np

import dartwork_mpl as dm

np.random.seed(42)

# Intentionally low-quality plot: very thin line, tiny title, no axis
# labels, microscopic scatter markers, overlapping huge annotations.
dm.style.use("scientific")
fig, (ax1, ax2) = plt.subplots(1, 2, figsize=dm.figsize("16cm", "cinema"))

x = np.linspace(0, 100, 10)  # Very sparse.
y = np.sin(x) * 1000  # Very large values.

# NOTE: The font-size and line-width literals below are *intentional
# anti-patterns* — this example exists to demonstrate what
# ``dm.helpers.quality.check_figure_quality`` catches. ``dm.fs/lw``
# would smooth them into preset-relative sizes and the example would
# silently stop reporting issues. Treat the ``fontsize=`` literals as
# pedagogical, not as recommended style.

ax1.plot(x, y, lw=0.1)  # Hairline.
ax1.set_title("plot with issues", fontsize=6)  # Tiny title.
# (Deliberately missing axis labels.)

ax2.scatter(x, y, s=1)  # Microscopic markers.
ax2.text(50, 0, "Label 1", fontsize=20)  # Overlapping …
ax2.text(51, 10, "Label 2", fontsize=20)  # … annotations.

print("Quality Check Results")
print("=" * 50)
issues = dm.helpers.quality.check_figure_quality(fig)
if issues:
    for i, issue in enumerate(issues, 1):
        print(f"{i}. {issue}")
else:
    print("No quality issues detected.")

print("\nChart Type Suggestions")
print("=" * 50)
data_examples = [
    ("categorical", "continuous", 5, 1, "Categorical data"),
    ("temporal", "continuous", 100, 1, "Time series"),
    ("continuous", "continuous", 100, 1, "Correlation data"),
    ("categorical", None, 5, 1, "Single categorical"),
]
for x_type, y_type, n_points, n_series, description in data_examples:
    suggestion = dm.helpers.quality.suggest_chart_type(
        x_type=x_type, y_type=y_type, n_points=n_points, n_series=n_series
    )
    print(f"{description}: {suggestion}")

plt.show()
Total running time of the script: (0 minutes 0.423 seconds)