Note
Go to the end to download the full example code.
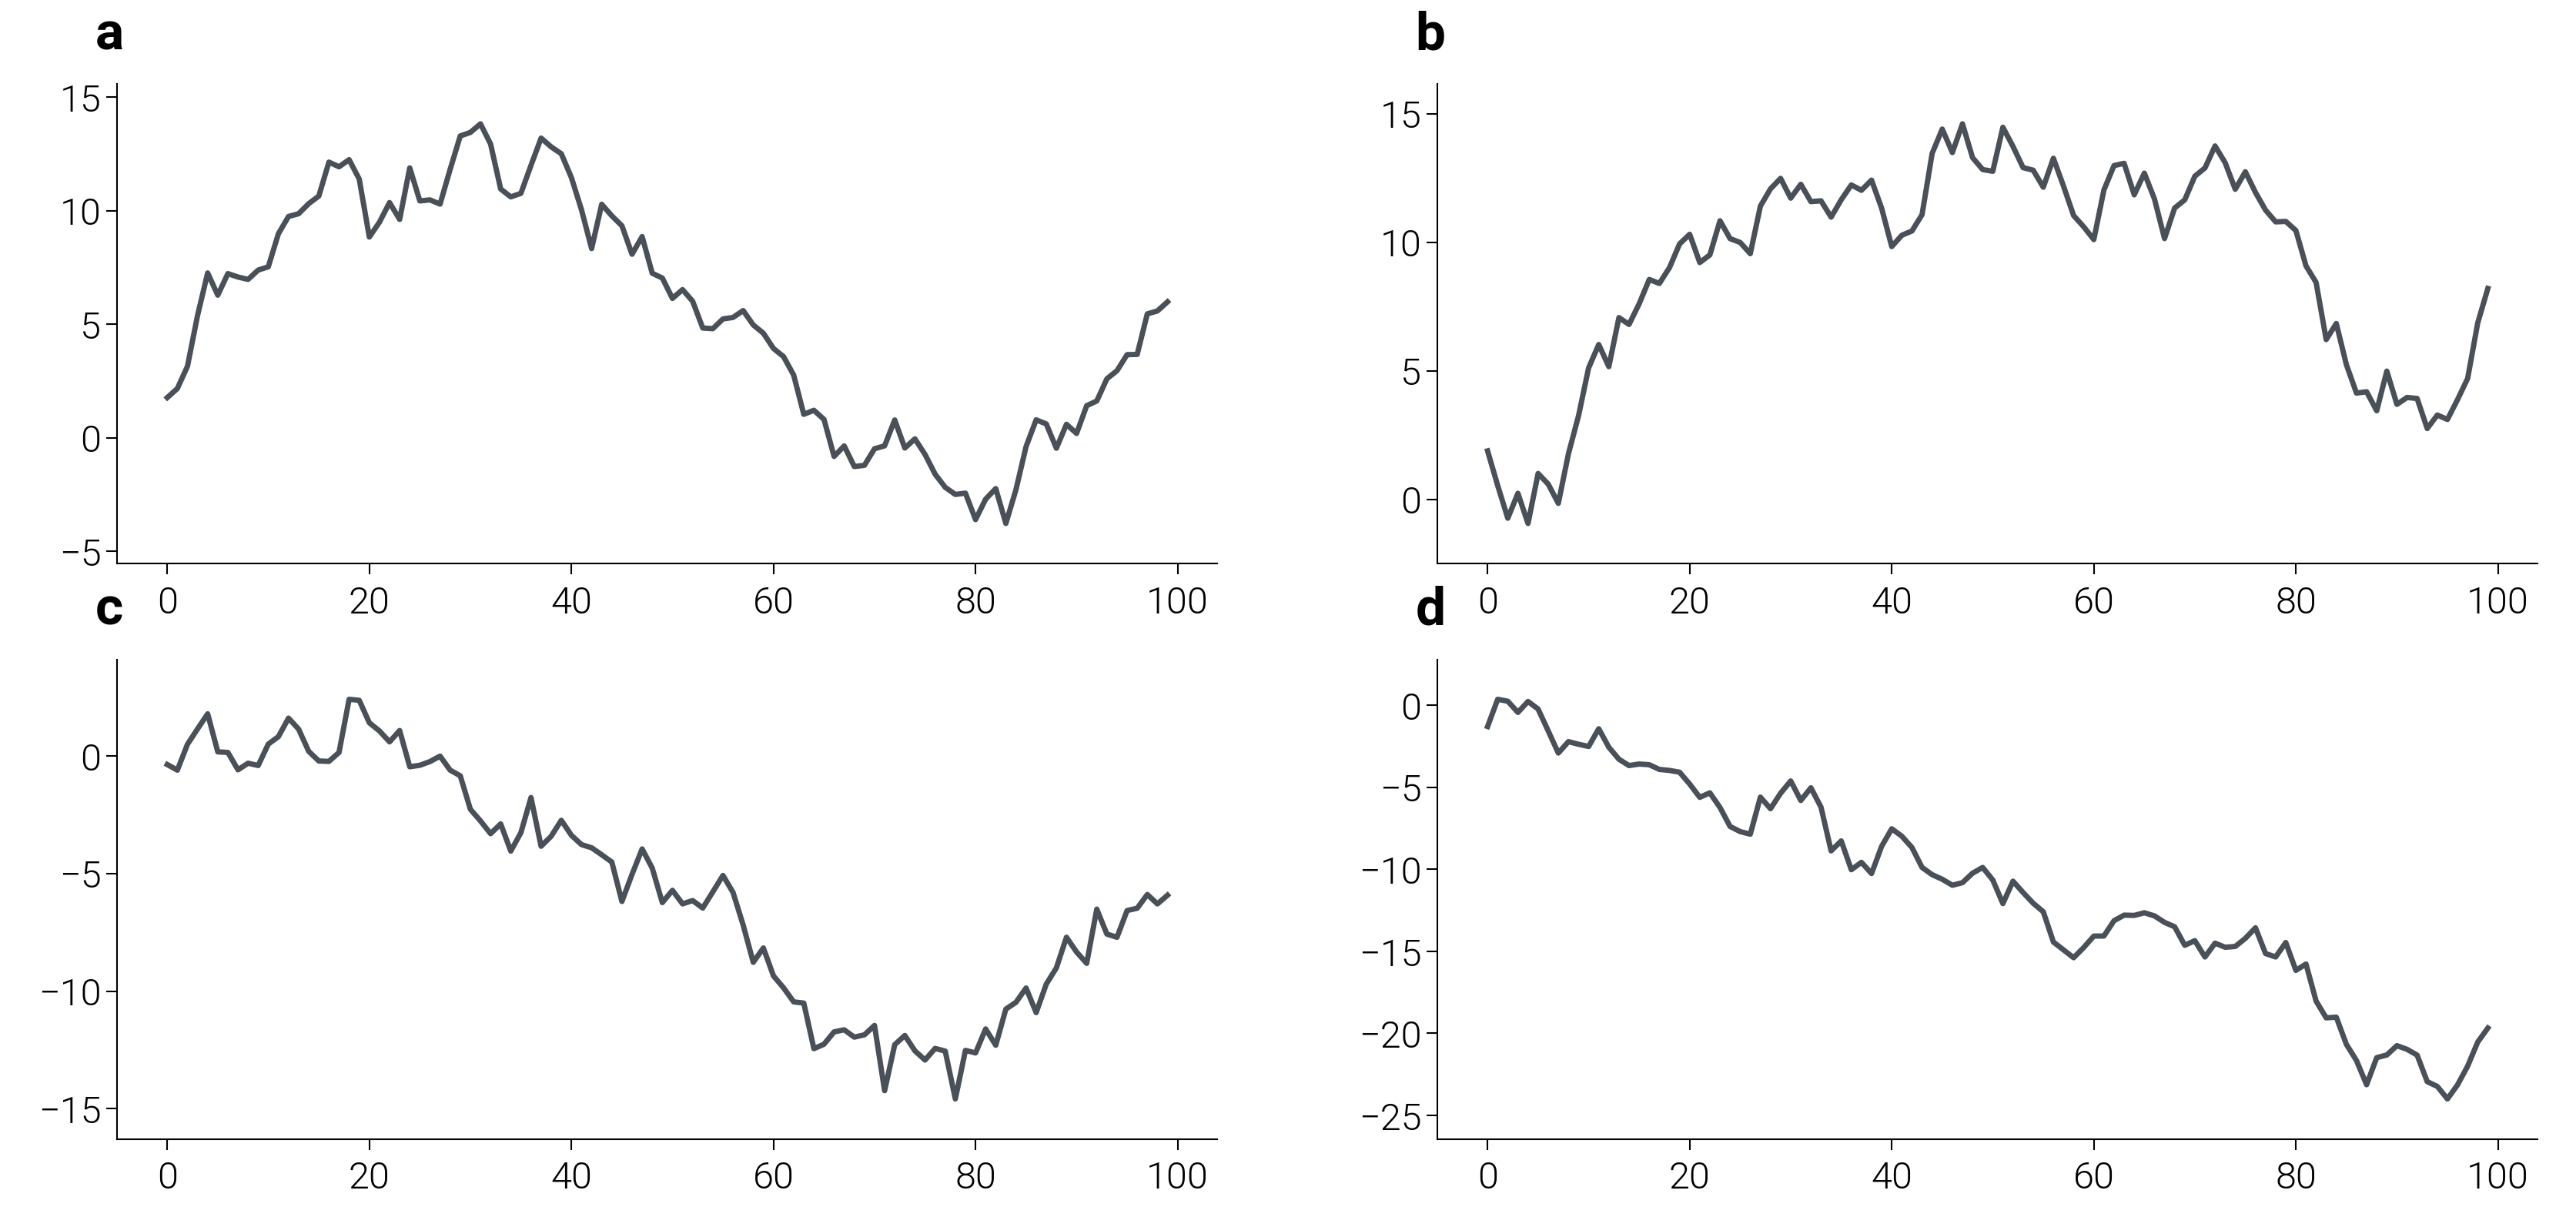
Automatic Panel Indexing
For academic publications, subplots require (a), (b), (c) labels.
dm.label_axes() automatically places indices at the top-left corner,
scaling its font size to match the active style preset.
import matplotlib.pyplot as plt
import numpy as np

import dartwork_mpl as dm

dm.style.use("scientific")

# 0.4 API: 2×2 uniform grid at the journal-friendly double-column
# width (17 cm = dm.col2) with a standard h/w ratio per panel.
fig, axes = plt.subplots(2, 2, figsize=dm.figsize("17cm", "standard"))

np.random.seed(0)
for ax in axes.flat:
    x = np.cumsum(np.random.randn(100))
    ax.plot(x, color="dc.indigo3", lw=dm.lw(0))
    ax.spines["right"].set_visible(False)
    ax.spines["top"].set_visible(False)

# Automatically add (a), (b), (c), (d) using label_axes
dm.label_axes(axes.flat)

# Direct-calc layout — measures every visible artist and places the
# GridSpec arithmetically.
dm.simple_layout(fig)
plt.show()
Total running time of the script: (0 minutes 0.950 seconds)