Note
Go to the end to download the full example code.
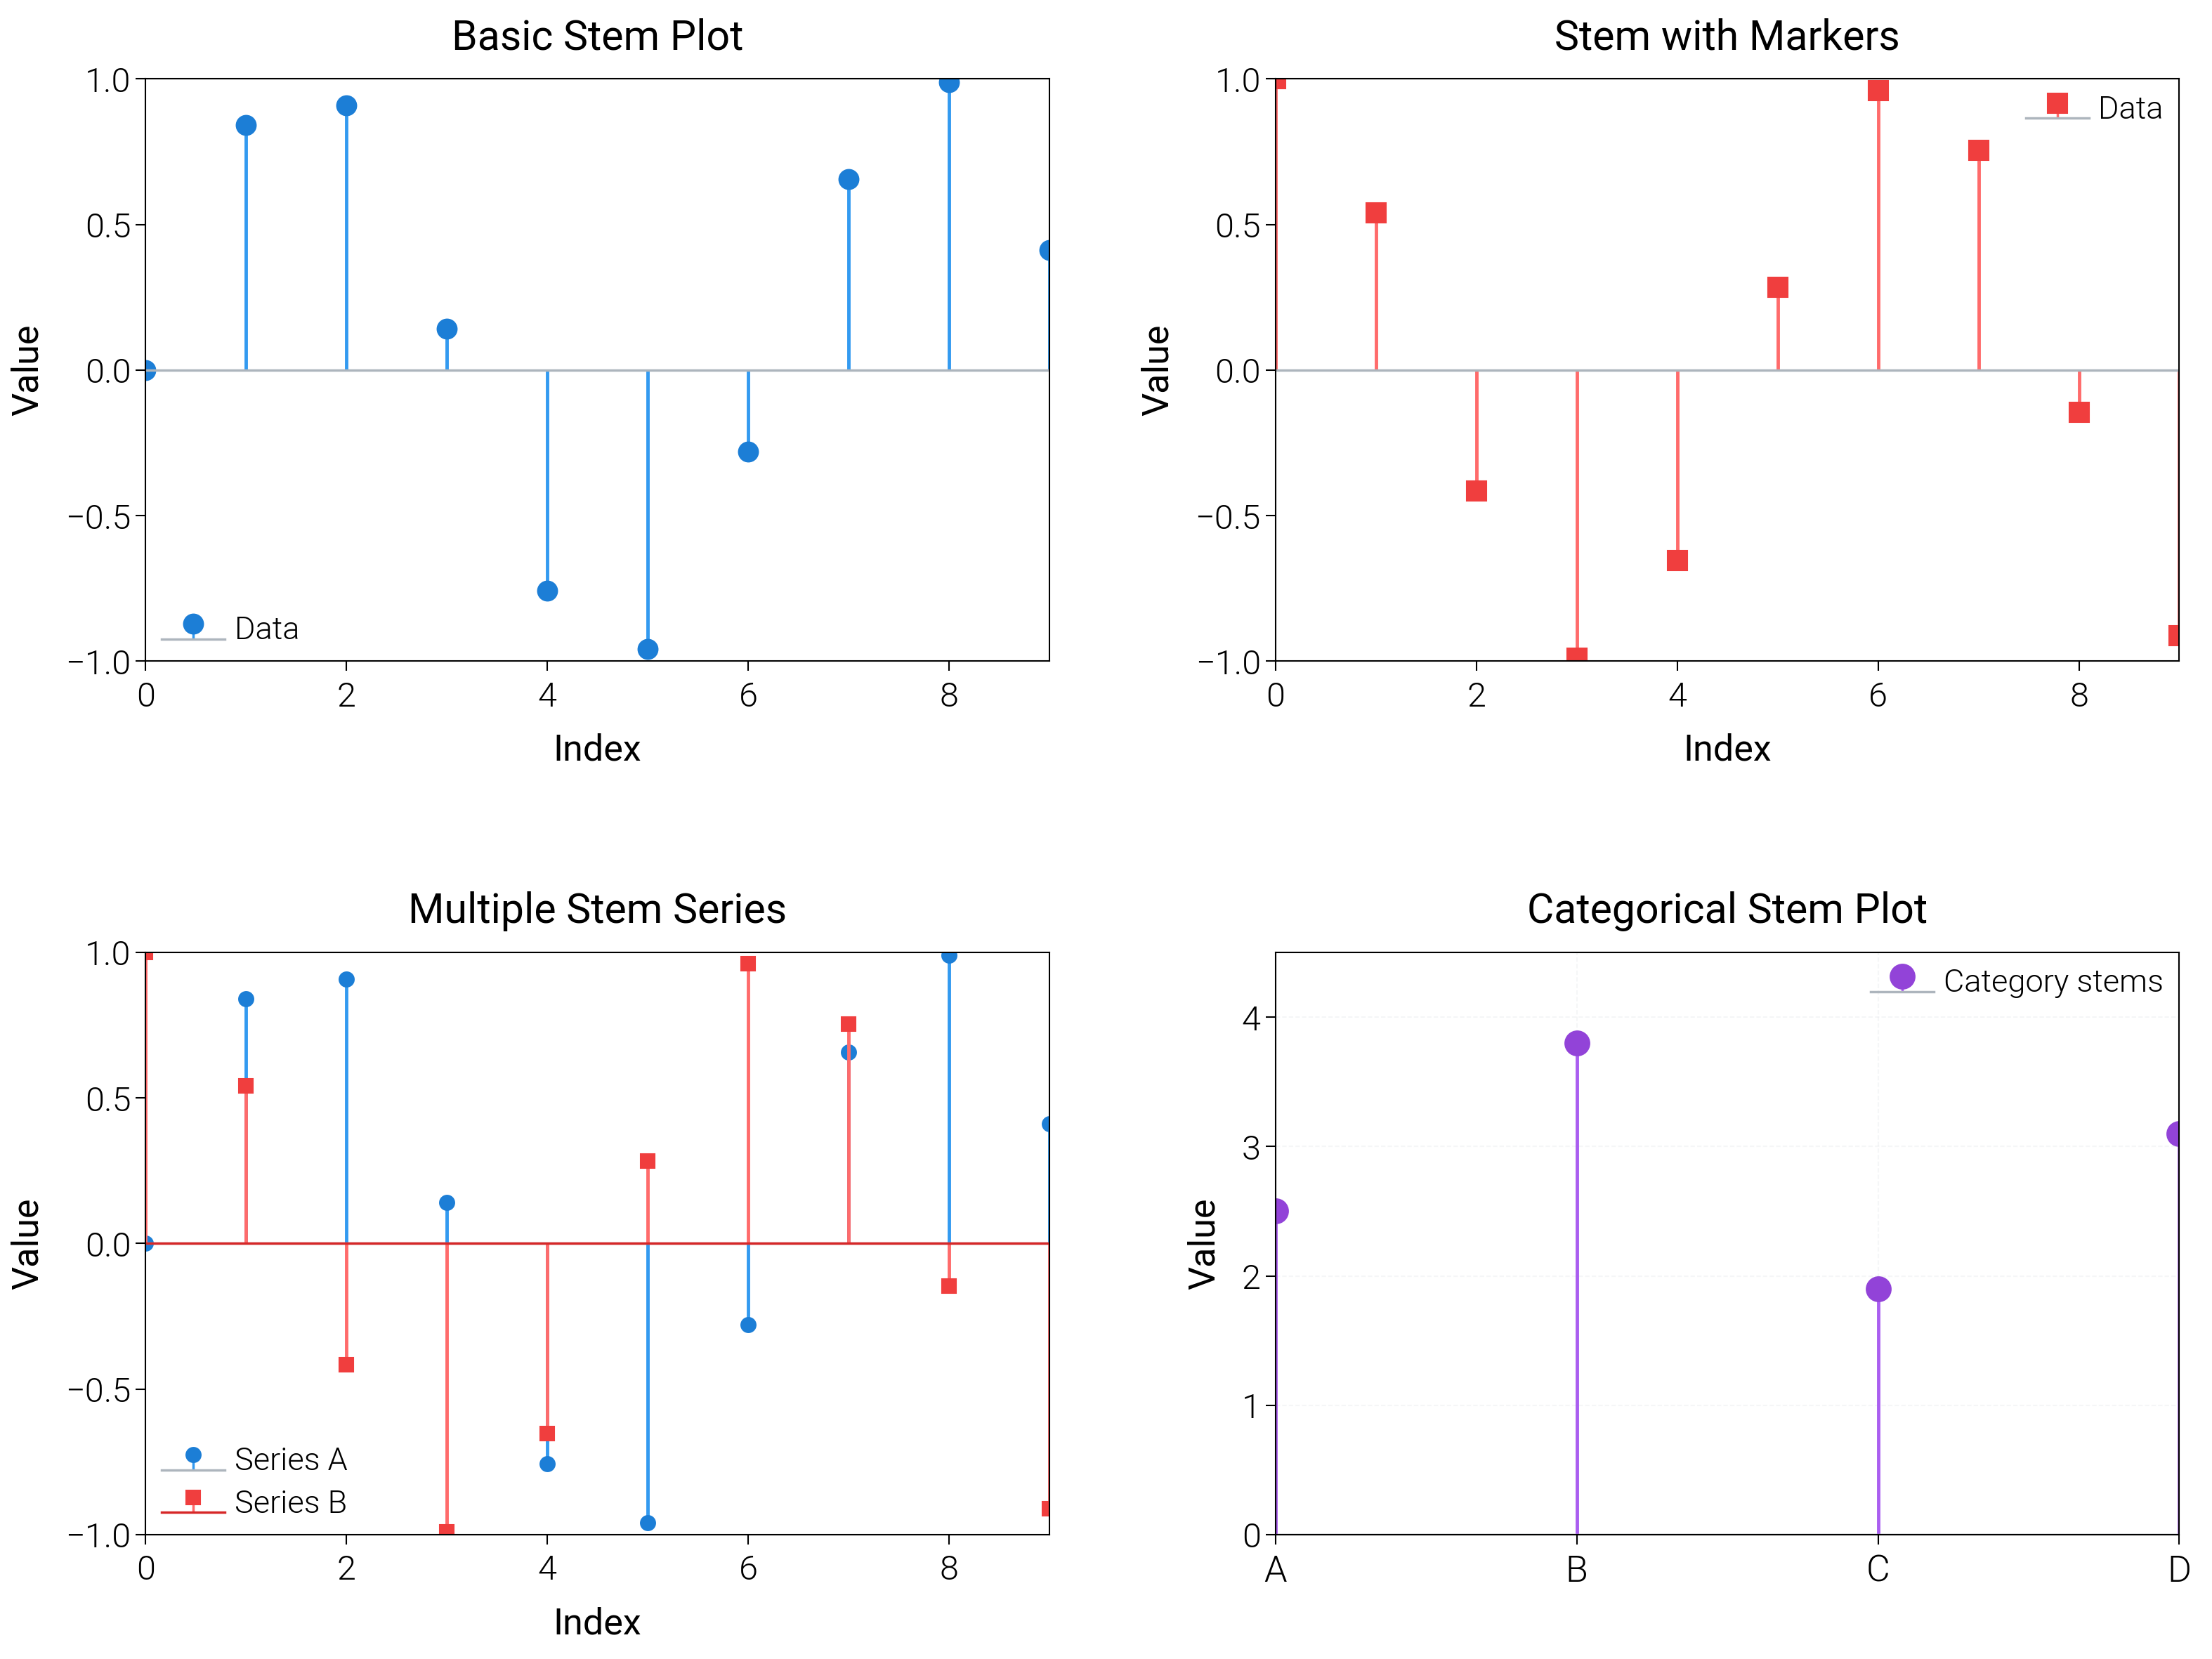
Stem Plots
Use stem plots for impulses, grouped spikes, and categorical events with careful labeling.
import matplotlib.colors as mcolors
import matplotlib.pyplot as plt
import numpy as np

import dartwork_mpl as dm

# Apply scientific style preset
# Default: font.size=7.5, lines.linewidth=0.5, axes.linewidth=0.3
dm.style.use("scientific")

# Generate sample data
x = np.arange(0, 10)
y1 = np.sin(x)
y2 = np.cos(x)
y3 = 0.5 * np.sin(2 * x)

# Create figure (square-ish): 16 cm wide, 12 cm tall
fig = plt.figure(figsize=(dm.cm2in(16), dm.cm2in(12)), dpi=300)

# Create GridSpec for 4 subplots (2x2)
gs = fig.add_gridspec(
    nrows=2,
    ncols=2,
    left=0.08,
    right=0.98,
    top=0.92,
    bottom=0.12,
    wspace=0.25,
    hspace=0.5,
)

# Panel A: Basic stem plot
ax1 = fig.add_subplot(gs[0, 0])
# Explicit parameters: linefmt, markerfmt, basefmt
# Note: stem() doesn't accept dartwork-mpl color strings in format strings,
# so we use standard format strings and set colors separately
markerline1, stemlines1, baseline1 = ax1.stem(
    x, y1, linefmt="-", markerfmt="o", basefmt="-", label="Data"
)
# Set colors and line widths: lw=0.7 for stem lines
plt.setp(stemlines1, linewidth=0.7, color=mcolors.to_rgb("oc.blue5"))
plt.setp(baseline1, linewidth=0.5, color=mcolors.to_rgb("oc.gray5"))
plt.setp(
    markerline1,
    markersize=4,
    markeredgewidth=0.3,
    markerfacecolor=mcolors.to_rgb("oc.blue7"),
    markeredgecolor=mcolors.to_rgb("oc.blue7"),
)
ax1.set_xlabel("Index", fontsize=dm.fs(0))
ax1.set_ylabel("Value", fontsize=dm.fs(0))
ax1.set_title("Basic Stem Plot", fontsize=dm.fs(1))
ax1.legend(loc="best", fontsize=dm.fs(-1), ncol=1)
ax1.set_xticks([0, 2, 4, 6, 8])
ax1.set_yticks([-1, -0.5, 0, 0.5, 1])

# Panel B: Stem with markers
ax2 = fig.add_subplot(gs[0, 1])
# Explicit parameters: different marker style
markerline2, stemlines2, baseline2 = ax2.stem(
    x, y2, linefmt="-", markerfmt="s", basefmt="-", label="Data"
)
plt.setp(stemlines2, linewidth=0.7, color=mcolors.to_rgb("oc.red5"))
plt.setp(baseline2, linewidth=0.5, color=mcolors.to_rgb("oc.gray5"))
plt.setp(
    markerline2,
    markersize=4,
    markeredgewidth=0.3,
    markerfacecolor=mcolors.to_rgb("oc.red7"),
    markeredgecolor=mcolors.to_rgb("oc.red7"),
)
ax2.set_xlabel("Index", fontsize=dm.fs(0))
ax2.set_ylabel("Value", fontsize=dm.fs(0))
ax2.set_title("Stem with Markers", fontsize=dm.fs(1))
ax2.legend(loc="best", fontsize=dm.fs(-1), ncol=1)
ax2.set_xticks([0, 2, 4, 6, 8])
ax2.set_yticks([-1, -0.5, 0, 0.5, 1])

# Panel C: Multiple stem series
ax3 = fig.add_subplot(gs[1, 0])
# First stem: lw=0.7
markerline3a, stemlines3a, baseline3a = ax3.stem(
    x, y1, linefmt="-", markerfmt="o", basefmt="-", label="Series A"
)
plt.setp(stemlines3a, linewidth=0.7, color=mcolors.to_rgb("oc.blue5"))
plt.setp(
    markerline3a,
    markersize=3,
    markeredgewidth=0.3,
    markerfacecolor=mcolors.to_rgb("oc.blue7"),
    markeredgecolor=mcolors.to_rgb("oc.blue7"),
)
# Second stem: lw=0.7
markerline3b, stemlines3b, baseline3b = ax3.stem(
    x, y2, linefmt="-", markerfmt="s", basefmt="-", label="Series B"
)
plt.setp(stemlines3b, linewidth=0.7, color=mcolors.to_rgb("oc.red5"))
plt.setp(
    markerline3b,
    markersize=3,
    markeredgewidth=0.3,
    markerfacecolor=mcolors.to_rgb("oc.red7"),
    markeredgecolor=mcolors.to_rgb("oc.red7"),
)
plt.setp(baseline3a, linewidth=0.5, color=mcolors.to_rgb("oc.gray5"))
ax3.set_xlabel("Index", fontsize=dm.fs(0))
ax3.set_ylabel("Value", fontsize=dm.fs(0))
ax3.set_title("Multiple Stem Series", fontsize=dm.fs(1))
ax3.legend(loc="best", fontsize=dm.fs(-1), ncol=1)
ax3.set_xticks([0, 2, 4, 6, 8])
ax3.set_yticks([-1, -0.5, 0, 0.5, 1])

# Panel D: Categorical stems with jitter
ax4 = fig.add_subplot(gs[1, 1])
cats = np.array(["A", "B", "C", "D"])
cat_values = np.array([2.5, 3.8, 1.9, 3.1])
jitter_x = np.arange(len(cats))
markerline4, stemlines4, baseline4 = ax4.stem(
    jitter_x,
    cat_values,
    linefmt="-",
    markerfmt="o",
    basefmt="-",
    label="Category stems",
)
plt.setp(stemlines4, linewidth=0.7, color=mcolors.to_rgb("oc.purple5"))
plt.setp(
    markerline4,
    markersize=5,
    markeredgewidth=0.3,
    markerfacecolor=mcolors.to_rgb("oc.purple7"),
    markeredgecolor=mcolors.to_rgb("oc.purple7"),
)
plt.setp(baseline4, linewidth=0.5, color=mcolors.to_rgb("oc.gray5"))
ax4.set_xticks(jitter_x)
ax4.set_xticklabels(cats, fontsize=dm.fs(0))
ax4.set_ylabel("Value", fontsize=dm.fs(0))
ax4.set_title("Categorical Stem Plot", fontsize=dm.fs(1))
ax4.set_ylim(0, 4.5)
ax4.legend(loc="best", fontsize=dm.fs(-1), ncol=1)
ax4.grid(True, linestyle="--", linewidth=0.3, alpha=0.3)

# Optimize layout
dm.simple_layout(fig, gs=gs)

# Show plot
plt.show()
Total running time of the script: (0 minutes 1.739 seconds)