Note
Go to the end to download the full example code.
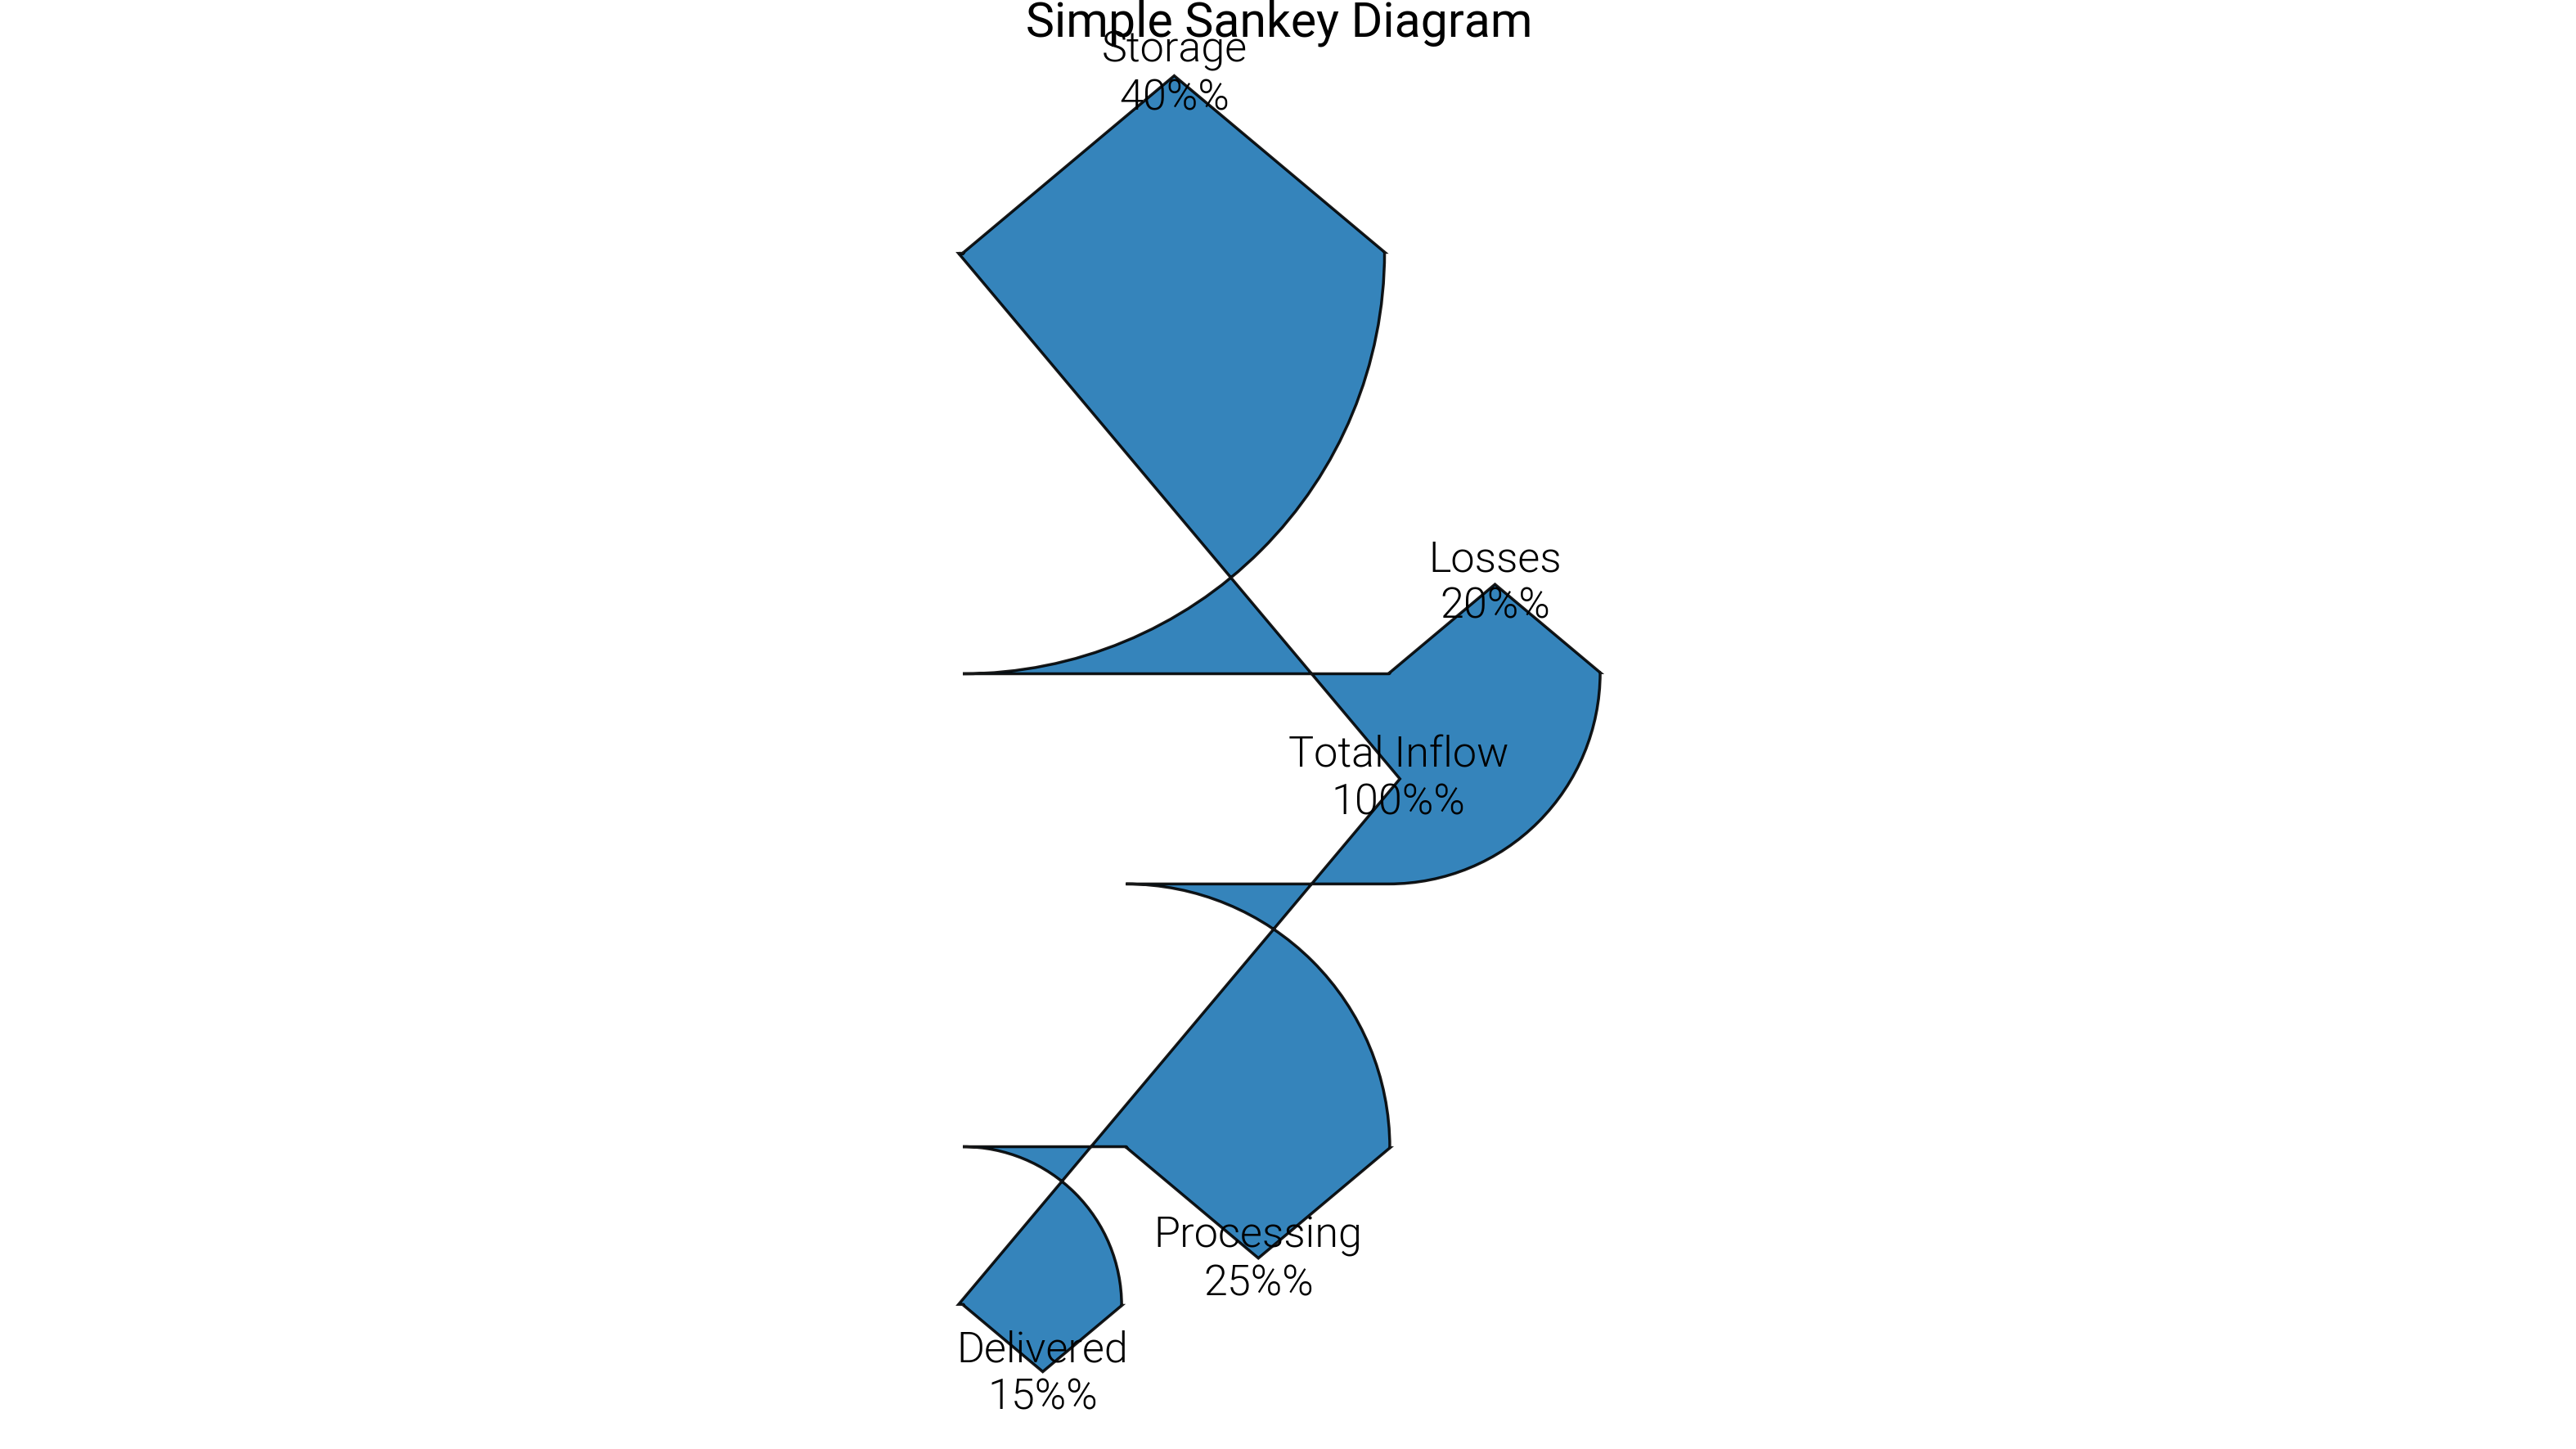
Sankey Diagram
Show a single, clear Sankey diagram that illustrates how inputs split into several outputs.
Ignoring fixed x limits to fulfill fixed data aspect with adjustable data limits.
Ignoring fixed x limits to fulfill fixed data aspect with adjustable data limits.
import matplotlib.pyplot as plt
from matplotlib.sankey import Sankey

import dartwork_mpl as dm

# Apply consistent styling
dm.style.use("scientific")

# Flows sum to zero: inflow = 100, outflows = -40, -25, -20, -15
flows = [100, -40, -25, -20, -15]
labels = ["Total Inflow", "Storage", "Processing", "Losses", "Delivered"]
# Orientation controls label/arrow direction for readability
orientations = [0, 1, -1, 1, -1]

fig, ax = plt.subplots(figsize=(dm.cm2in(16), dm.cm2in(9)), dpi=300)

sankey = Sankey(
    ax=ax,
    unit="%",
    format="%.0f%%",
    scale=1.0,  # keep values literal (100 == 100%)
    gap=0.5,  # breathing room between flows
    shoulder=0.02,  # tighter joints
)
sankey.add(
    flows=flows,
    labels=labels,
    orientations=orientations,
    trunklength=1.0,
    pathlengths=[0.0, 0.1, 0.1, 0.1, 0.1],
    alpha=0.9,
)
sankey.finish()

ax.set_title("Simple Sankey Diagram", fontsize=dm.fs(1))
ax.axis("off")
dm.simple_layout(fig)

plt.show()
Total running time of the script: (0 minutes 0.389 seconds)