Note
Go to the end to download the full example code.
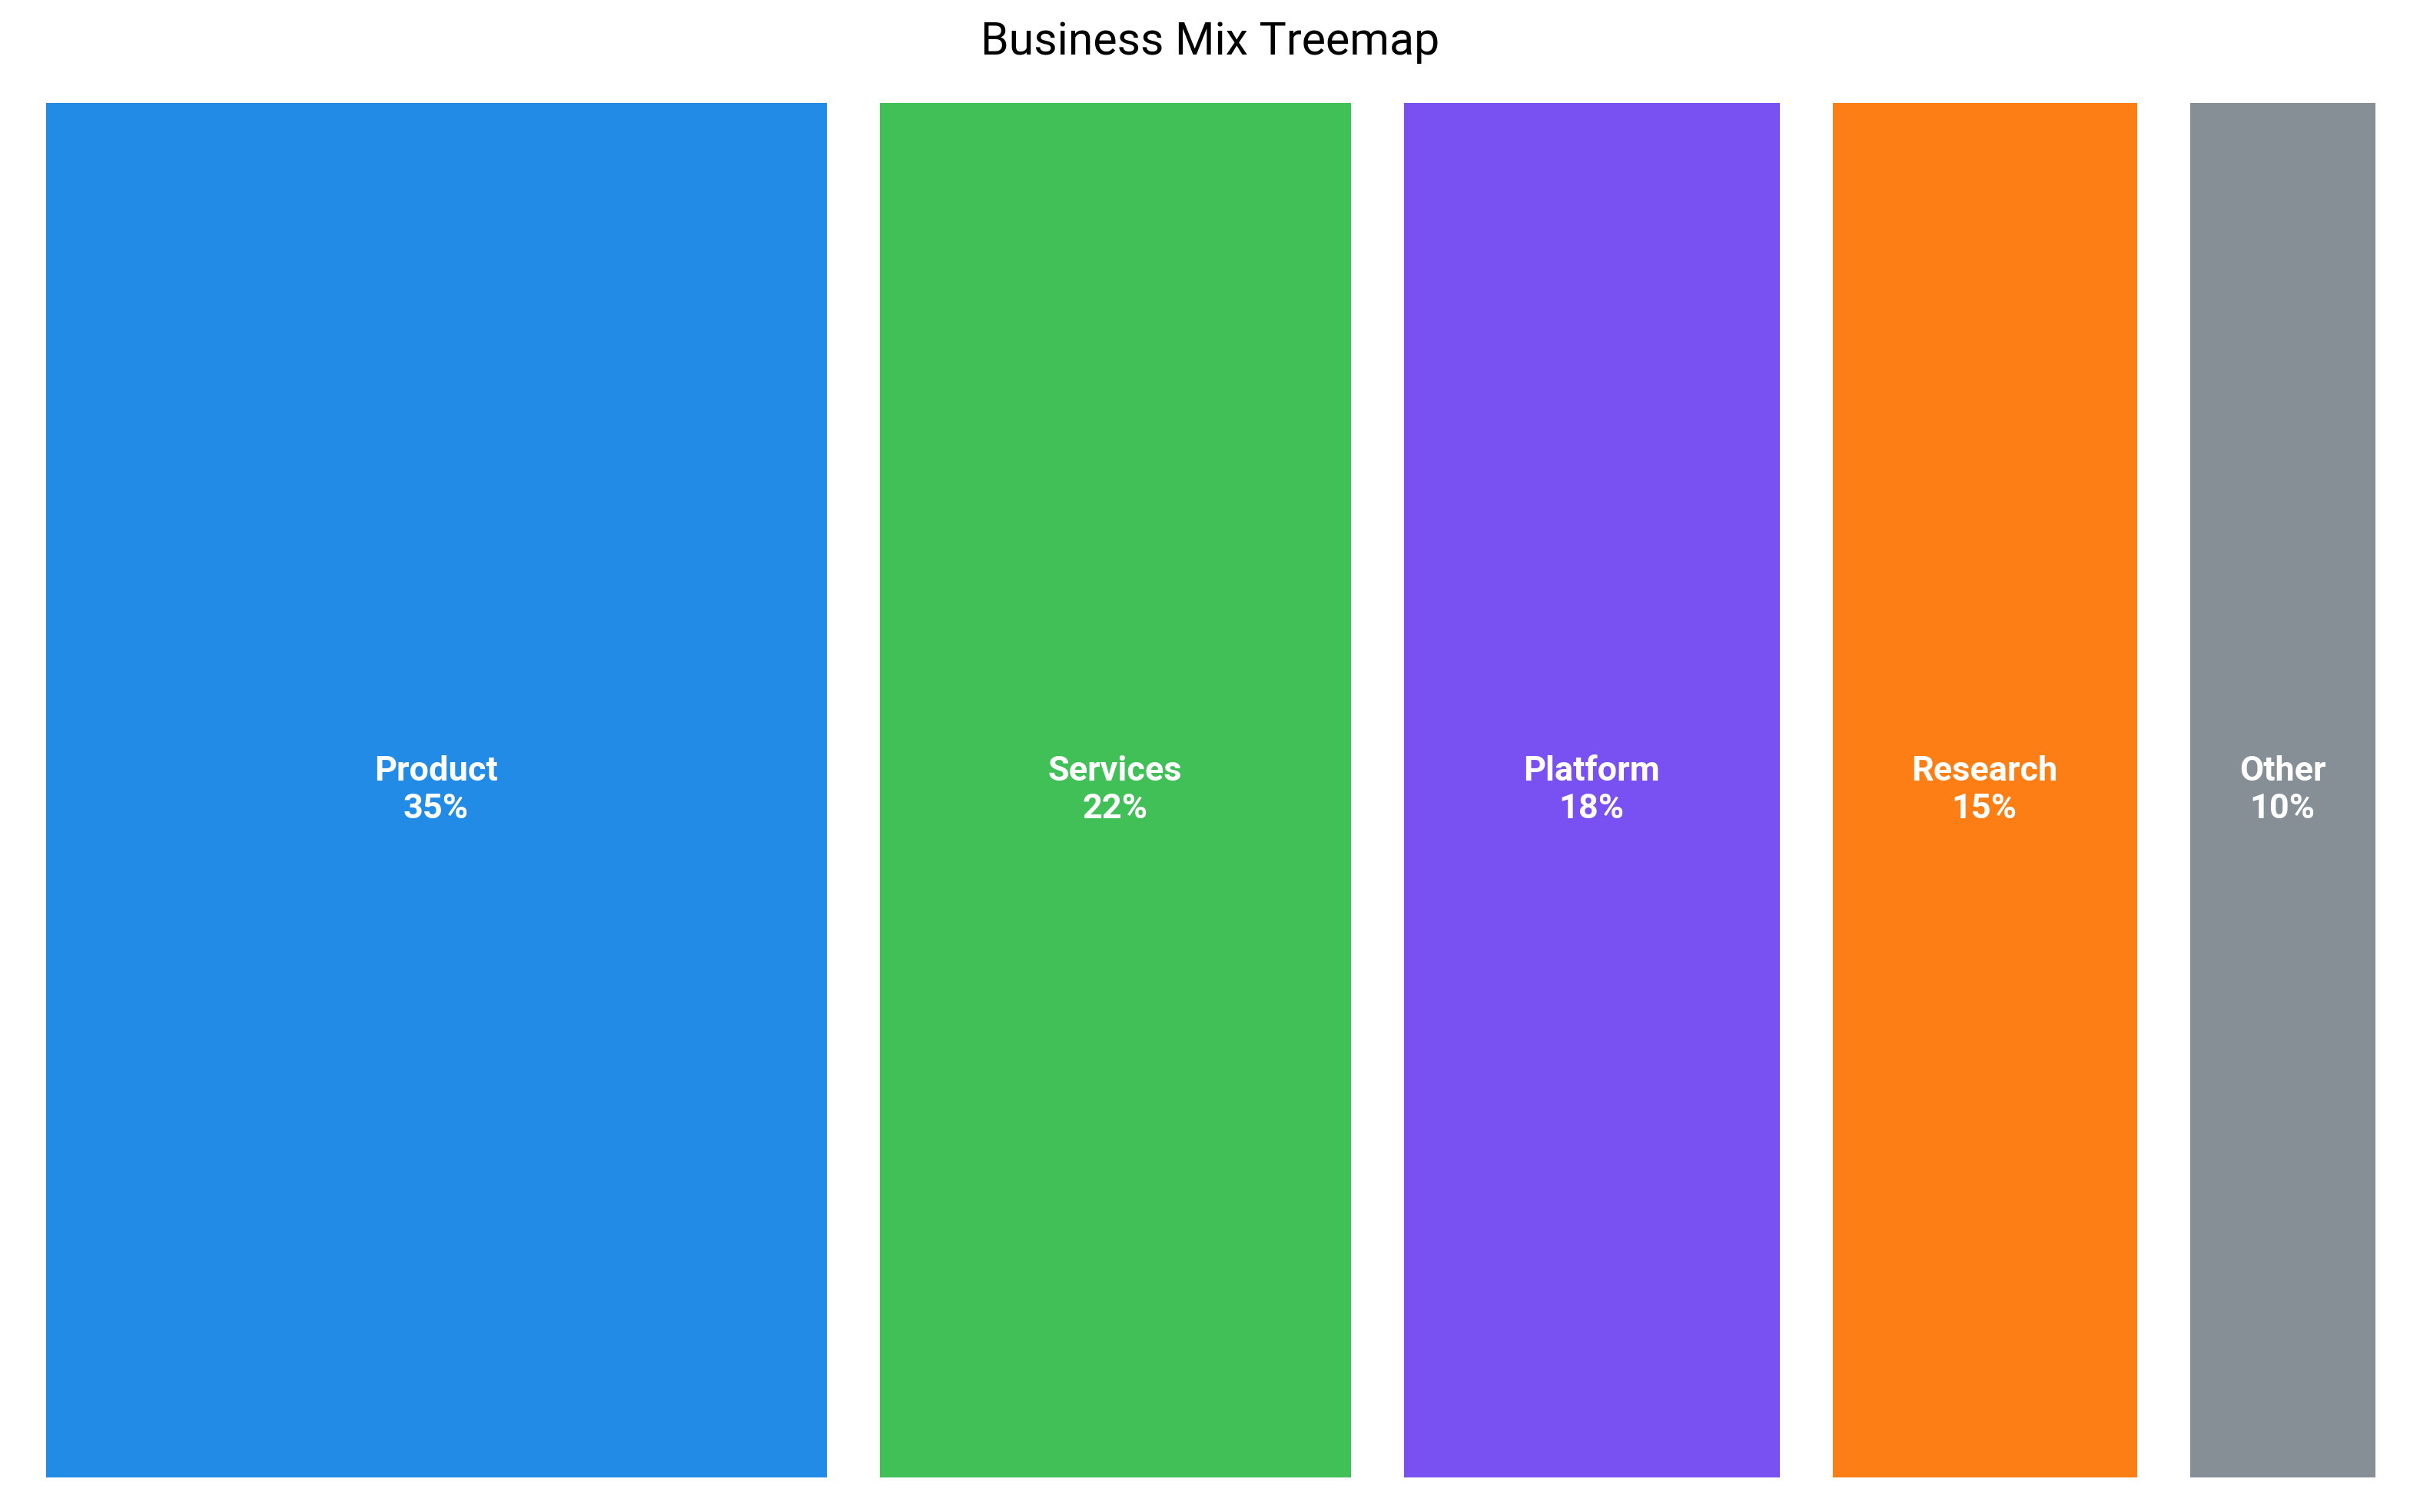
Treemap
Show a clean, proportional treemap for a single hierarchy using a slice-and-dice layout.
import matplotlib.pyplot as plt
from matplotlib.patches import Rectangle

import dartwork_mpl as dm

dm.style.use("scientific")


def slice_dice(values, x=0.0, y=0.0, w=1.0, h=1.0, vertical=True):
    """Simple slice-and-dice treemap layout."""
    total = sum(val for _, val, _ in values)
    cursor = x if vertical else y
    for name, val, color in values:
        frac = val / total if total else 0
        if vertical:
            width = w * frac
            rng = (cursor, y, width, h)
            cursor += width
        else:
            height = h * frac
            rng = (x, cursor, w, height)
            cursor += height
        yield name, val, color, rng


def draw_treemap(ax, values):
    """Draw a single-level treemap with subtle padding and labels."""
    padding = 0.01
    for i, (name, val, color, (x, y, w, h)) in enumerate(
        slice_dice(values, vertical=True)
    ):
        # Alternate slice direction for a balanced look
        inner_values = [(name, val, color)]
        if i % 2:
            for _name, _val, _color, inner in slice_dice(
                inner_values, x, y, w, h, vertical=False
            ):
                x, y, w, h = inner
        x += padding
        y += padding
        w -= 2 * padding
        h -= 2 * padding
        ax.add_patch(
            Rectangle(
                (x, y), w, h, facecolor=color, edgecolor="white", linewidth=1.0
            )
        )
        ax.text(
            x + w / 2,
            y + h / 2,
            f"{name}\n{val}%",
            ha="center",
            va="center",
            color="white",
            fontsize=dm.fs(-1),
            weight="bold",
        )


values = [
    ("Product", 35, "oc.blue6"),
    ("Services", 22, "oc.green6"),
    ("Platform", 18, "oc.violet6"),
    ("Research", 15, "oc.orange6"),
    ("Other", 10, "oc.gray6"),
]

fig, ax = plt.subplots(figsize=(dm.cm2in(16), dm.cm2in(10)), dpi=300)
draw_treemap(ax, values)
ax.set_xlim(0, 1)
ax.set_ylim(0, 1)
ax.axis("off")
ax.set_title("Business Mix Treemap", fontsize=dm.fs(1))

dm.simple_layout(fig)
plt.show()
Total running time of the script: (0 minutes 0.424 seconds)