Note
Go to the end to download the full example code.
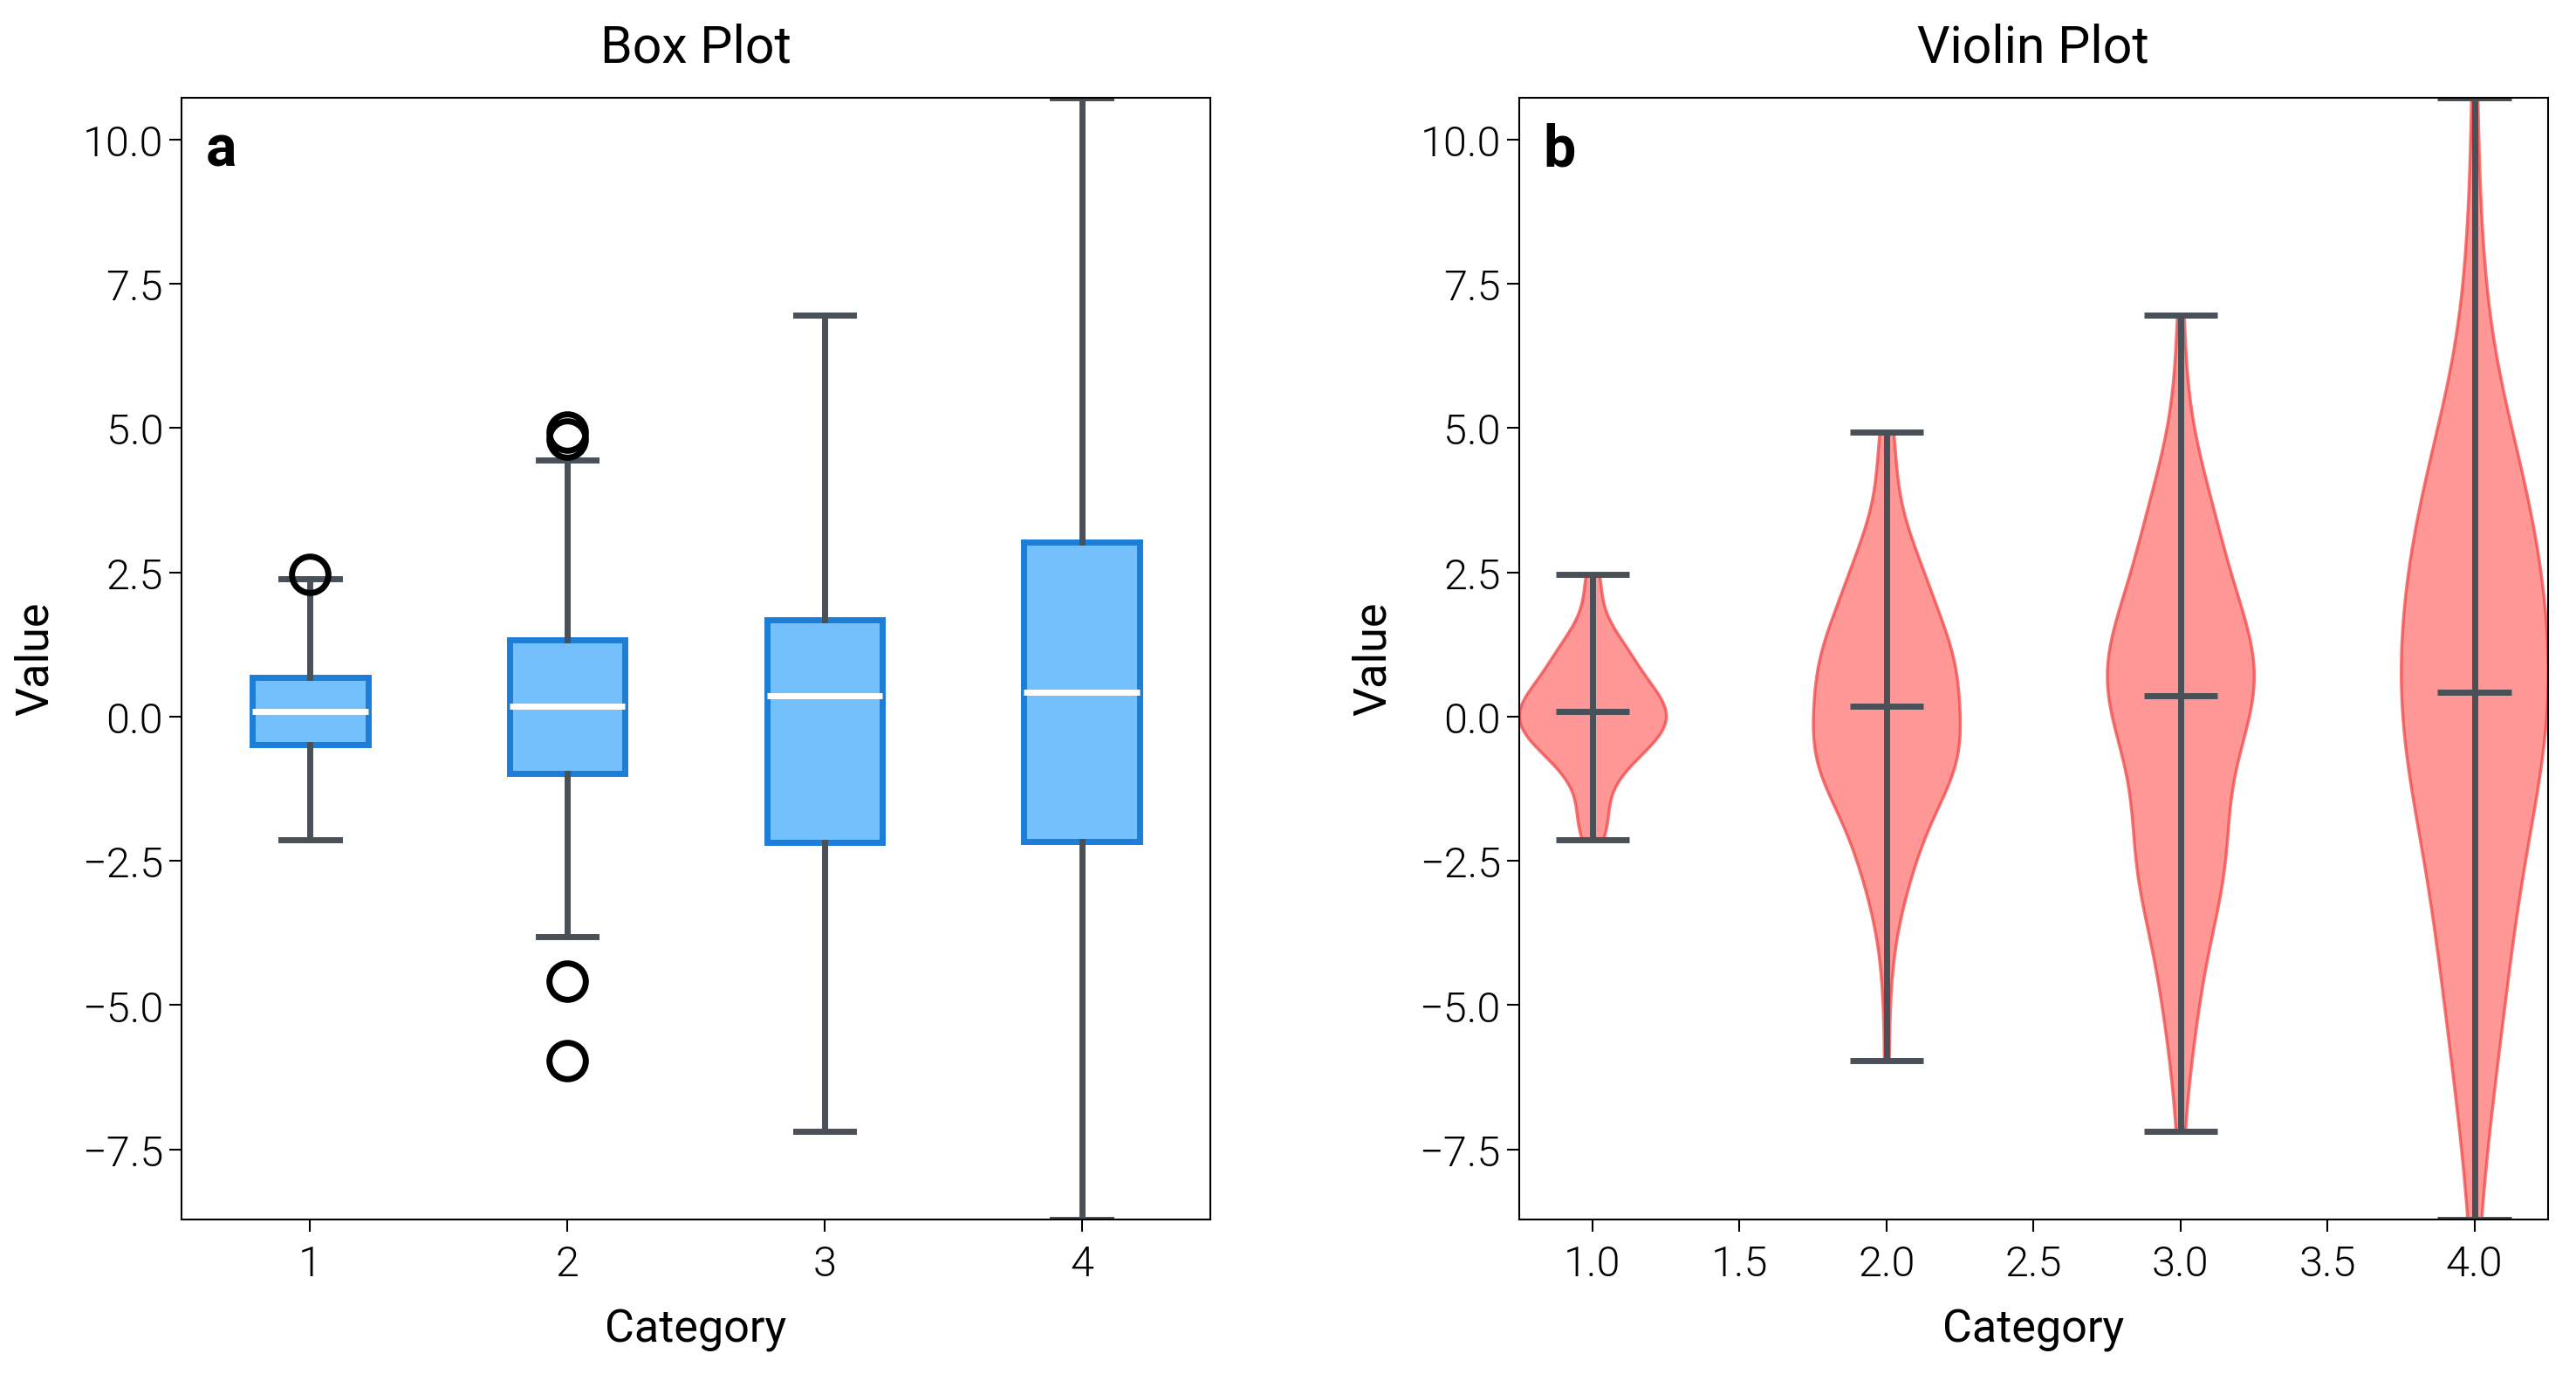
Violin and Box Plots
Pair boxplots and violins to show summary stats and full distributions in one glance.
import matplotlib.pyplot as plt
import numpy as np

import dartwork_mpl as dm

# Apply scientific style
dm.style.use("scientific")

# Generate data
np.random.seed(10)
data = [np.random.normal(0, std, 100) for std in range(1, 5)]

fig = plt.figure(figsize=(dm.cm2in(15), dm.cm2in(8)), dpi=300)
gs = fig.add_gridspec(
    1, 2, left=0.08, right=0.98, top=0.92, bottom=0.12, wspace=0.3
)

# Box Plot
ax1 = fig.add_subplot(gs[0])
ax1.boxplot(
    data,
    patch_artist=True,
    boxprops={"facecolor": "oc.blue3", "color": "oc.blue7"},
    medianprops={"color": "white"},
    whiskerprops={"color": "oc.gray7"},
    capprops={"color": "oc.gray7"},
)
ax1.set_title("Box Plot", fontsize=dm.fs(1))
ax1.set_xlabel("Category", fontsize=dm.fs(0))
ax1.set_ylabel("Value", fontsize=dm.fs(0))

# Violin Plot
ax2 = fig.add_subplot(gs[1])
parts = ax2.violinplot(data, showmeans=False, showmedians=True)

# Customize violin plot colors
for pc in parts["bodies"]:
    pc.set_facecolor("oc.red5")
    pc.set_edgecolor("oc.red7")
    pc.set_alpha(0.7)

for partname in ("cbars", "cmins", "cmaxes", "cmedians"):
    vp = parts[partname]
    vp.set_edgecolor("oc.gray7")
    vp.set_linewidth(1)

ax2.set_title("Violin Plot", fontsize=dm.fs(1))
ax2.set_xlabel("Category", fontsize=dm.fs(0))
ax2.set_ylabel("Value", fontsize=dm.fs(0))

# Add subplot labels
for ax, label in zip([ax1, ax2], "ab", strict=False):
    offset = dm.make_offset(4, -4, fig)
    ax.text(
        0,
        1,
        label,
        transform=ax.transAxes + offset,
        weight="bold",
        va="top",
        fontsize=dm.fs(2),
    )

dm.simple_layout(fig, gs=gs)
plt.show()
Total running time of the script: (0 minutes 1.230 seconds)