Note
Go to the end to download the full example code.
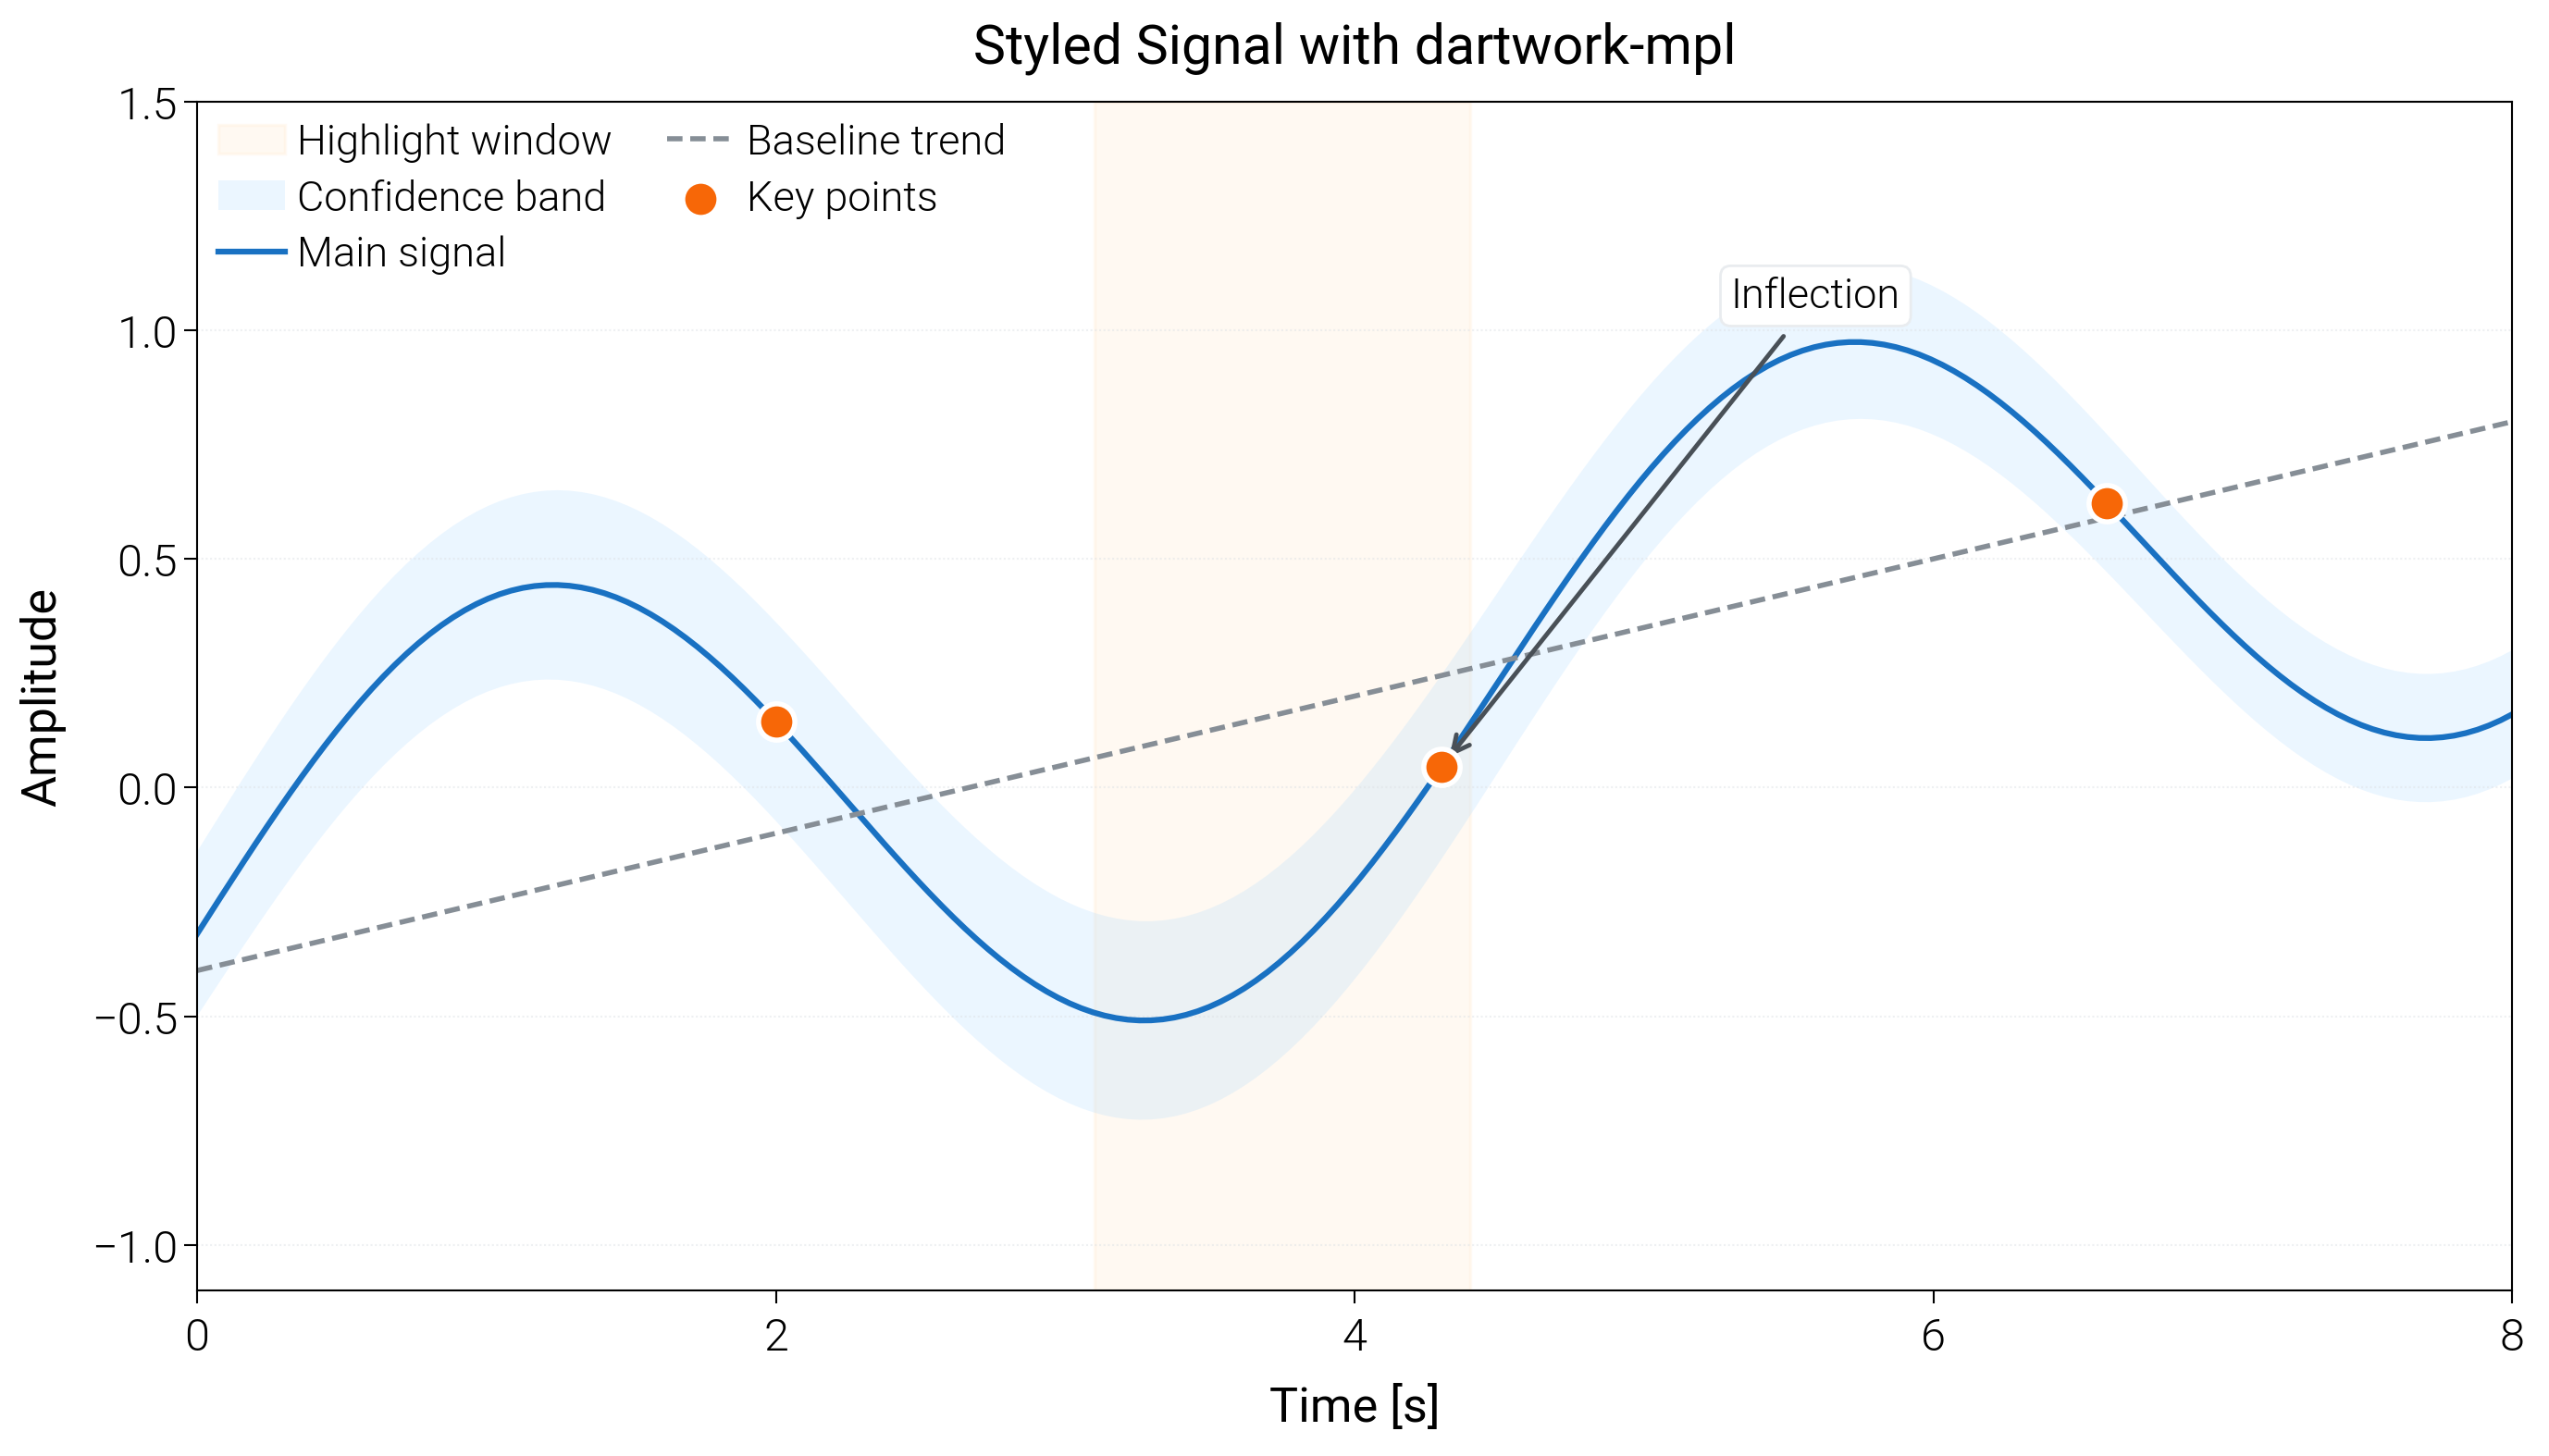
Basic Usage
Showcase dartwork-mpl presets with custom colors, bands, annotations, and spacing on a single stylized line plot.
import matplotlib.pyplot as plt
import numpy as np

import dartwork_mpl as dm

# Apply scientific style preset
dm.style.use("scientific")

# Generate sample data
x = np.linspace(0, 8, 200)
trend = 0.15 * x - 0.4
signal = 0.6 * np.sin(1.4 * x) + 0.08 * np.cos(0.5 * x)
series = trend + signal
band = 0.18 + 0.04 * np.sin(0.6 * x)
upper = series + band
lower = series - band

# Key markers to highlight peaks
mark_x = np.array([2.0, 4.3, 6.6])
mark_y = np.interp(mark_x, x, series)

# Create figure with tuned margins
fig = plt.figure(figsize=(dm.cm2in(14), dm.cm2in(8)), dpi=300)
gs = fig.add_gridspec(
    nrows=1, ncols=1, left=0.14, right=0.97, top=0.9, bottom=0.18
)
ax = fig.add_subplot(gs[0, 0])

# Shaded window and confidence band
ax.axvspan(3.1, 4.4, color="oc.orange1", alpha=0.25, label="Highlight window")
ax.fill_between(
    x,
    lower,
    upper,
    color="oc.blue2",
    alpha=0.22,
    edgecolor="none",
    label="Confidence band",
)

# Styled lines
ax.plot(x, series, color="oc.blue8", lw=0.9, label="Main signal")
ax.plot(
    x, trend, color="oc.gray6", lw=0.8, linestyle="--", label="Baseline trend"
)

# Markers and annotations
ax.scatter(
    mark_x,
    mark_y,
    color="oc.orange7",
    edgecolor="white",
    linewidth=0.8,
    s=32,
    zorder=4,
    label="Key points",
)
ax.annotate(
    "Inflection",
    xy=(4.3, np.interp(4.3, x, series)),
    xytext=(5.3, 1.05),
    fontsize=dm.fs(-1),
    arrowprops={"arrowstyle": "->", "color": "oc.gray7", "lw": 0.7},
    bbox={
        "boxstyle": "round,pad=0.25",
        "fc": "white",
        "ec": "oc.gray2",
        "lw": 0.4,
    },
)

# Axes labels, ticks, and grid
ax.set_xlabel("Time [s]", fontsize=dm.fs(0))
ax.set_ylabel("Amplitude", fontsize=dm.fs(0))
ax.set_title("Styled Signal with dartwork-mpl", fontsize=dm.fs(1))
ax.set_xlim(0, 8)
ax.set_ylim(-1.1, 1.35)
ax.set_xticks([0, 2, 4, 6, 8])
ax.set_yticks([-1, -0.5, 0, 0.5, 1, 1.5])
ax.grid(axis="y", linestyle=":", color="oc.gray3", alpha=0.5)

# Legend placed above the plot to avoid overlaps
ax.legend(
    loc="best",
    ncol=2,
    fontsize=dm.fs(-1),
    frameon=False,
    columnspacing=1.3,
    handlelength=1.6,
)

# Optimize layout
dm.simple_layout(fig, gs=gs)

plt.show()
Total running time of the script: (0 minutes 0.771 seconds)