Note
Go to the end to download the full example code.
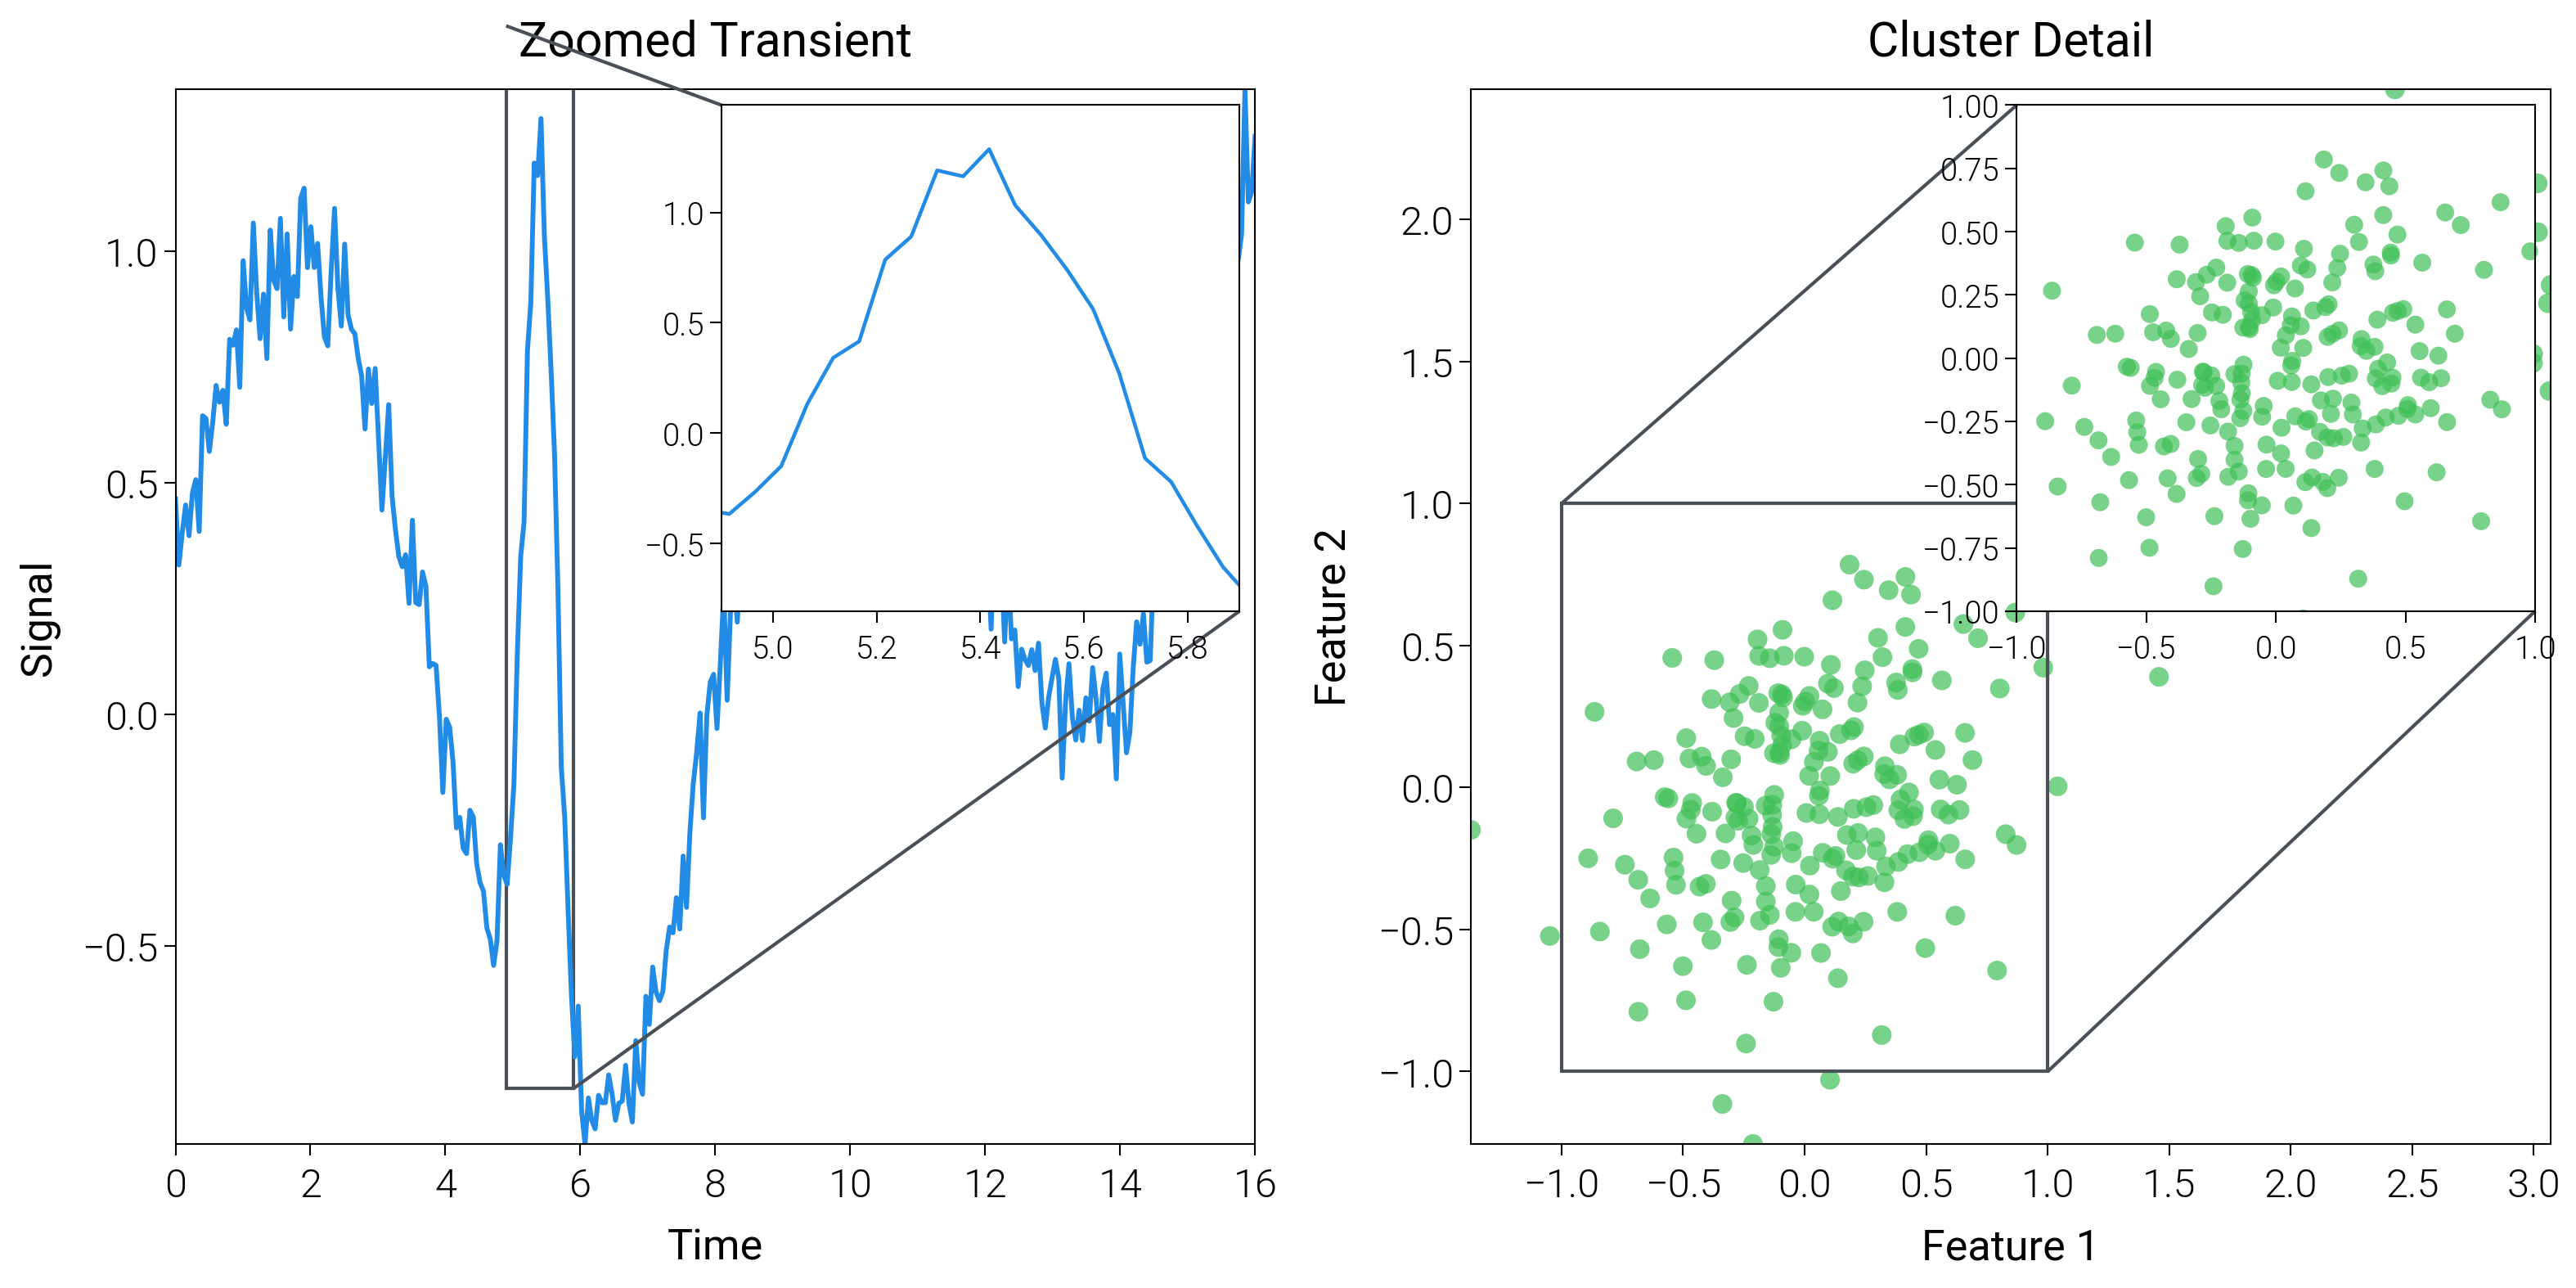
Inset Axes
Two concise examples: a zoomed transient in a time series, and a cluster detail inset for a scatter plot.
import matplotlib.pyplot as plt
import numpy as np
from mpl_toolkits.axes_grid1.inset_locator import inset_axes, mark_inset

import dartwork_mpl as dm

dm.style.use("scientific")

np.random.seed(7)
time = np.linspace(0, 16, 320)
base = 0.04 * time
signal = 0.8 * np.sin(0.8 * time) + 0.4 * np.cos(0.35 * time + 0.6)
burst = 2.0 * np.exp(-0.5 * ((time - 5.4) / 0.25) ** 2)
noise = 0.08 * np.random.randn(len(time))
series = base + signal + burst + noise

cluster_a = np.random.multivariate_normal(
    [0, 0], [[0.18, 0.05], [0.05, 0.14]], 220
)
cluster_b = np.random.multivariate_normal(
    [2.4, 1.6], [[0.10, 0.03], [0.03, 0.12]], 120
)
points = np.vstack([cluster_a, cluster_b])

fig, axs = plt.subplots(
    1, 2, figsize=(dm.cm2in(16), dm.cm2in(8)), dpi=300, constrained_layout=False
)

# Left: time series with zoomed transient
ax1 = axs[0]
ax1.plot(time, series, color="oc.blue6", lw=0.85)
ax1.set_xlabel("Time", fontsize=dm.fs(0))
ax1.set_ylabel("Signal", fontsize=dm.fs(0))
ax1.set_title("Zoomed Transient", fontsize=dm.fs(1))
axins1 = inset_axes(ax1, width="48%", height="48%", loc="upper right")
axins1.plot(time, series, color="oc.blue6", lw=0.65)
axins1.set_xlim(4.9, 5.9)
axins1.set_ylim(
    series[(time >= 4.9) & (time <= 5.9)].min() - 0.2,
    series[(time >= 4.9) & (time <= 5.9)].max() + 0.2,
)
axins1.tick_params(labelsize=dm.fs(-2))
mark_inset(ax1, axins1, loc1=2, loc2=4, fc="none", ec="oc.gray7", lw=0.6)

# Right: scatter with inset on dense cluster
ax2 = axs[1]
ax2.scatter(
    points[:, 0],
    points[:, 1],
    s=12,
    color="oc.green6",
    alpha=0.7,
    edgecolor="none",
)
ax2.set_xlabel("Feature 1", fontsize=dm.fs(0))
ax2.set_ylabel("Feature 2", fontsize=dm.fs(0))
ax2.set_title("Cluster Detail", fontsize=dm.fs(1))
axins2 = inset_axes(ax2, width="48%", height="48%", loc="upper right")
axins2.scatter(
    points[:, 0],
    points[:, 1],
    s=10,
    color="oc.green6",
    alpha=0.7,
    edgecolor="none",
)
axins2.set_xlim(-1.0, 1.0)
axins2.set_ylim(-1.0, 1.0)
axins2.tick_params(labelsize=dm.fs(-2))
mark_inset(ax2, axins2, loc1=2, loc2=4, fc="none", ec="oc.gray7", lw=0.6)

dm.simple_layout(fig)
plt.show()
Total running time of the script: (0 minutes 1.637 seconds)