Note
Go to the end to download the full example code.
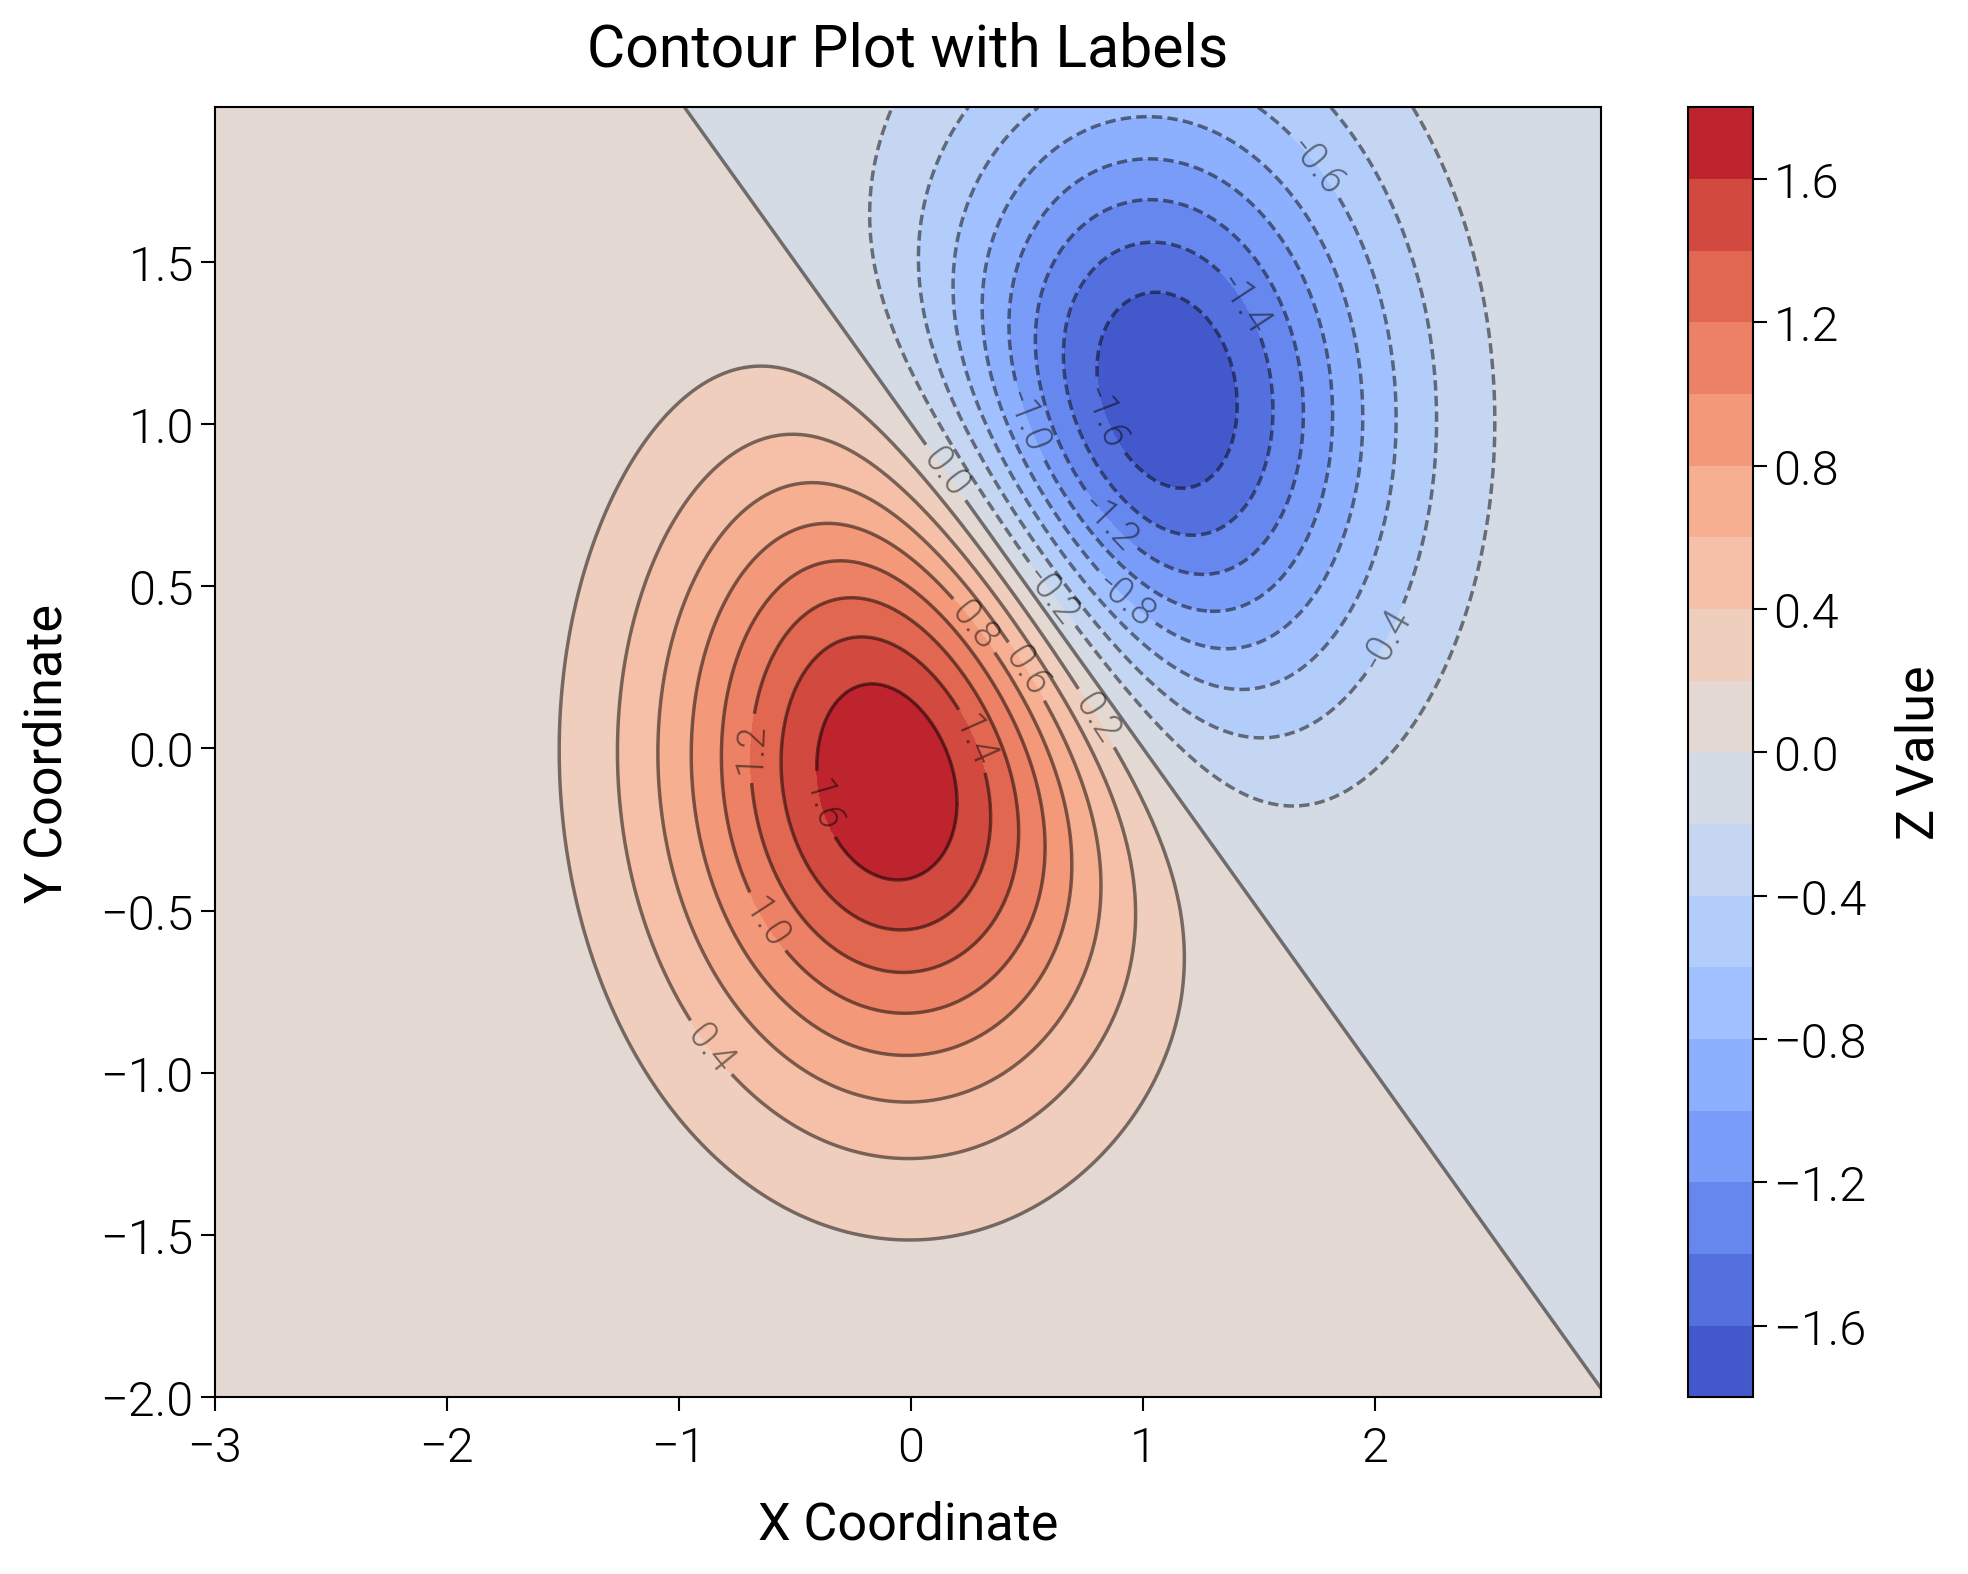
Contour Plots
Label contour maps with filled and line levels plus colorbars tuned for small multiples.
import matplotlib.pyplot as plt
import numpy as np

import dartwork_mpl as dm

# Apply scientific style
dm.style.use("scientific")

# Generate data
delta = 0.025
x = np.arange(-3.0, 3.0, delta)
y = np.arange(-2.0, 2.0, delta)
X, Y = np.meshgrid(x, y)
Z1 = np.exp(-(X**2) - Y**2)
Z2 = np.exp(-((X - 1) ** 2) - (Y - 1) ** 2)
Z = (Z1 - Z2) * 2

fig = plt.figure(figsize=(dm.cm2in(10), dm.cm2in(8)), dpi=300)
gs = fig.add_gridspec(1, 1, left=0.15, right=0.88, top=0.92, bottom=0.12)
ax = fig.add_subplot(gs[0, 0])

# Filled contour
# Use dartwork-mpl's coolwarm colormap
cs = ax.contourf(X, Y, Z, levels=20, cmap="dm.coolwarm")

# Add contour lines
line_cs = ax.contour(X, Y, Z, levels=20, colors="k", linewidths=0.5, alpha=0.5)

# Add labels to contour lines
ax.clabel(line_cs, inline=True, fontsize=dm.fs(-2), fmt="%1.1f")

# Add colorbar
cbar = fig.colorbar(cs, ax=ax)
cbar.set_label("Z Value", fontsize=dm.fs(0))

ax.set_title("Contour Plot with Labels", fontsize=dm.fs(1))
ax.set_xlabel("X Coordinate", fontsize=dm.fs(0))
ax.set_ylabel("Y Coordinate", fontsize=dm.fs(0))

dm.simple_layout(fig, gs=gs)
plt.show()
Total running time of the script: (0 minutes 1.111 seconds)