Note
Go to the end to download the full example code.
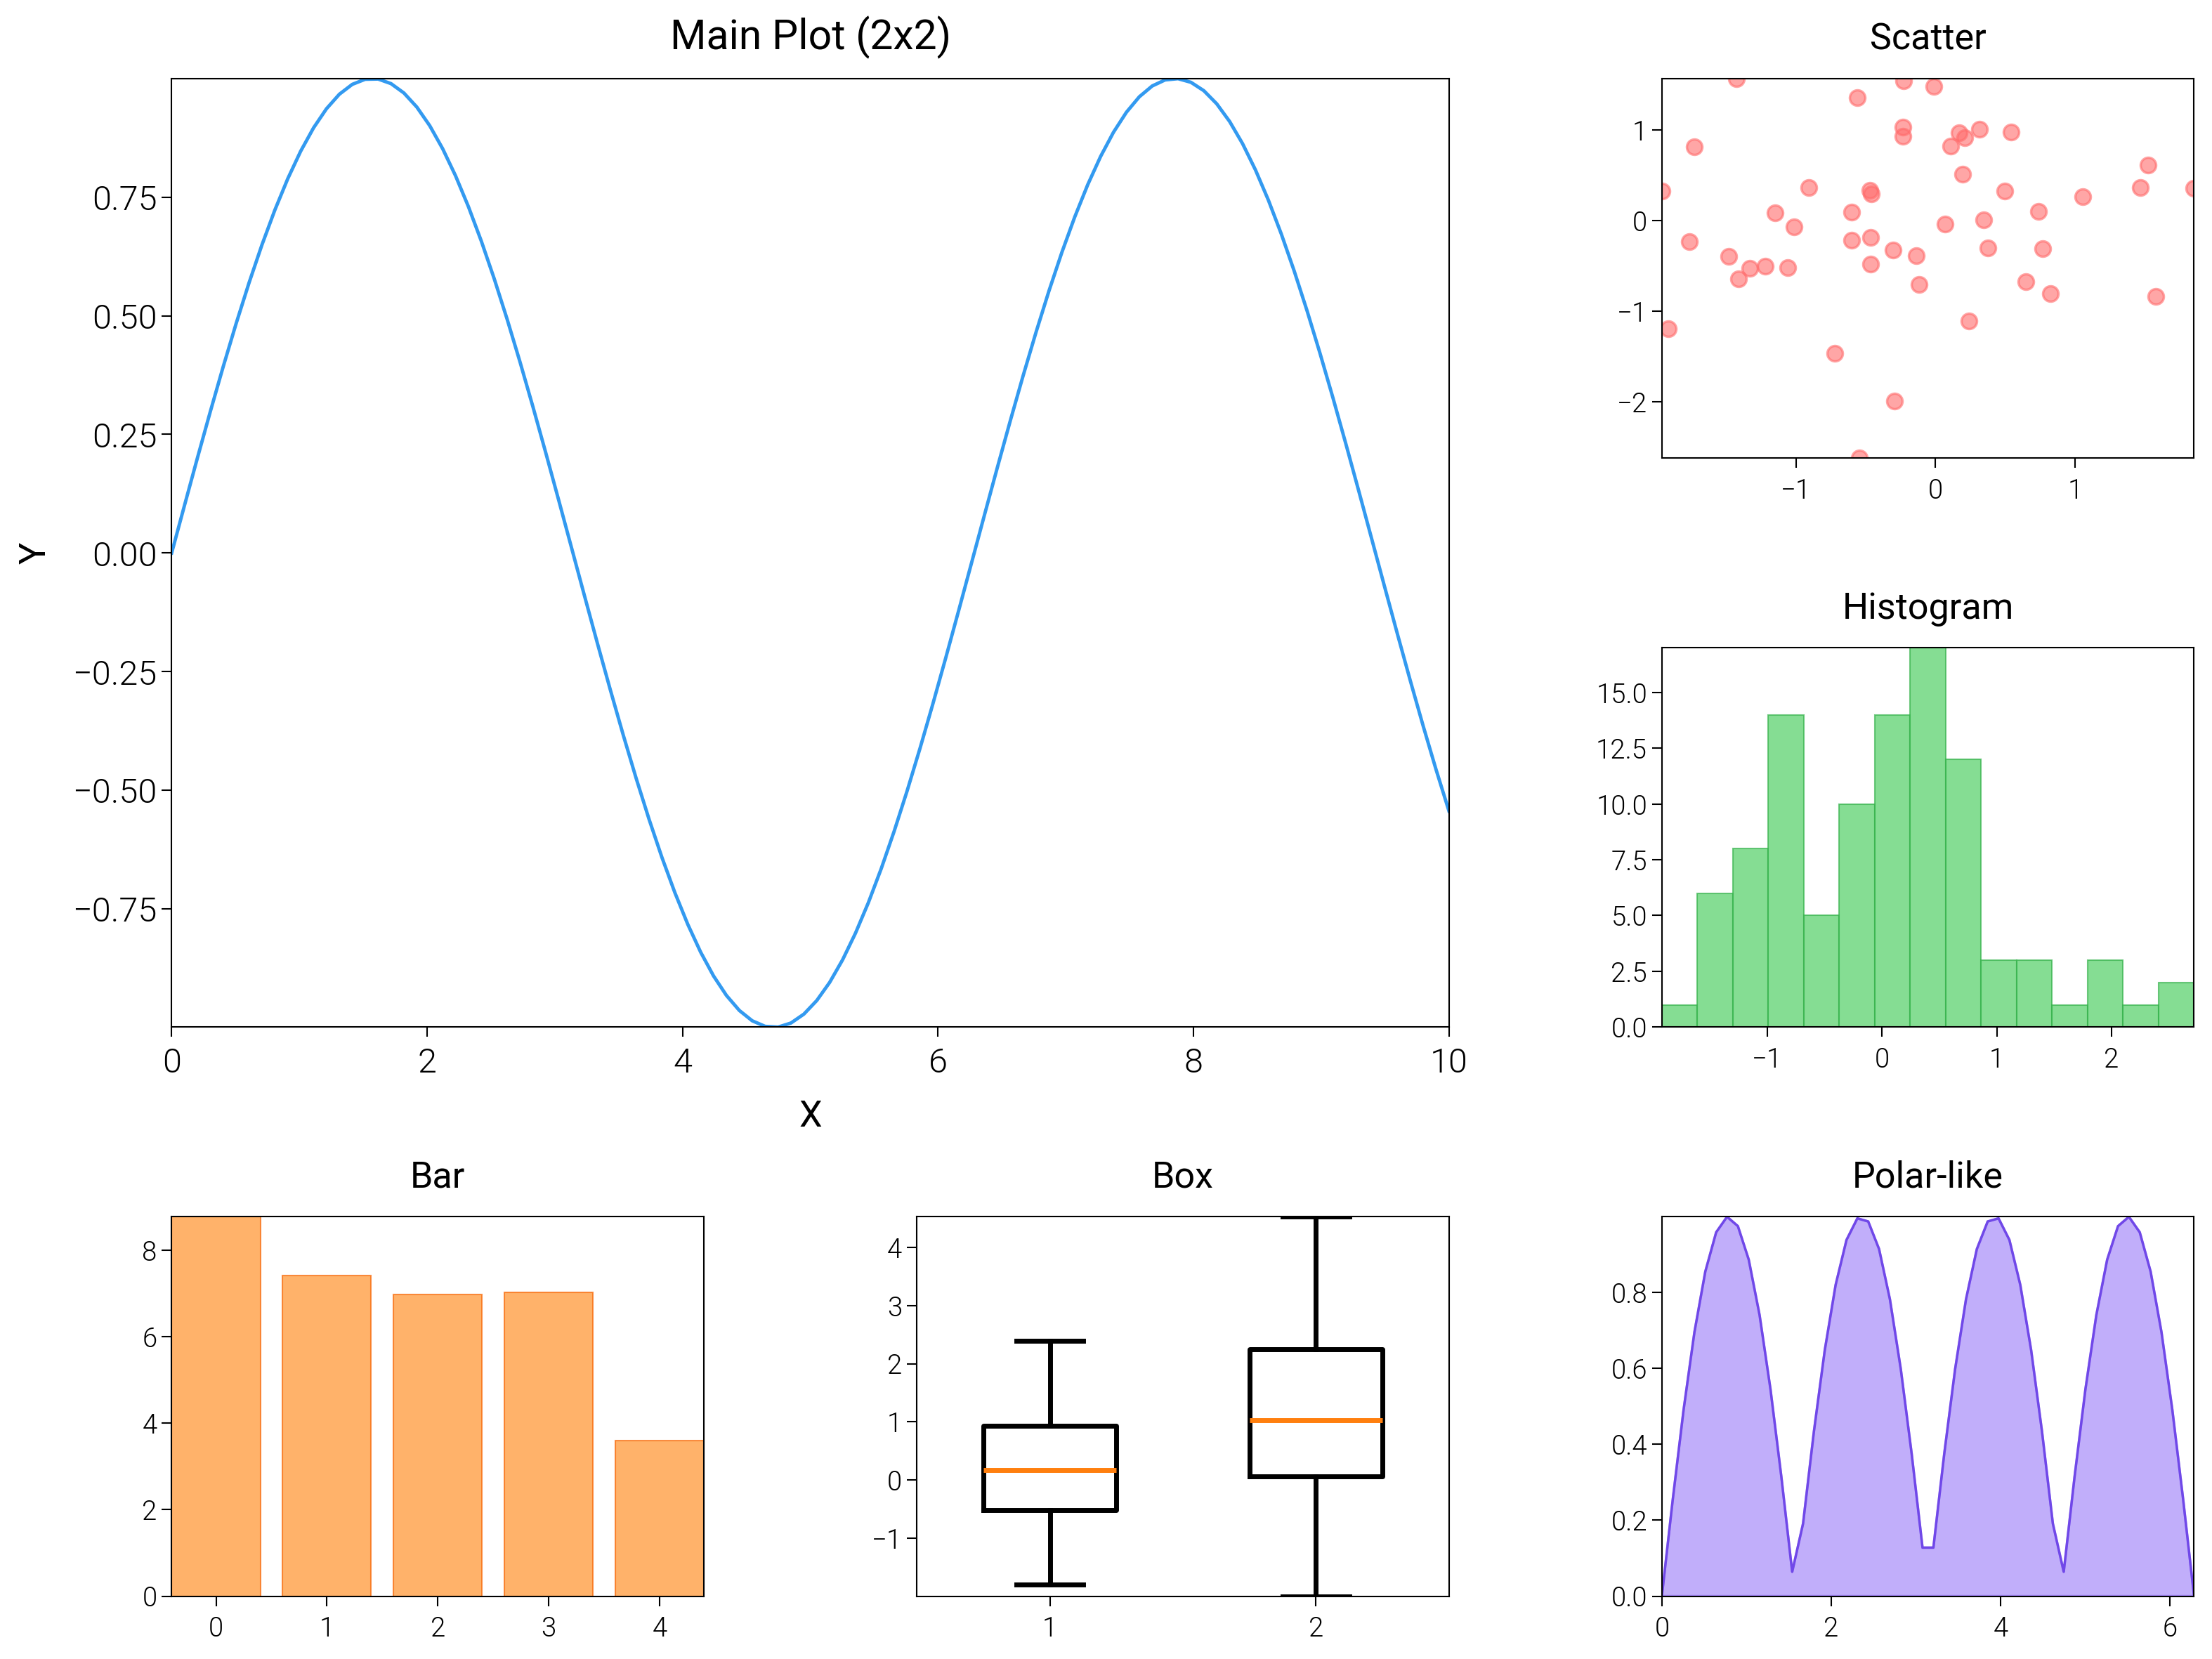
Complex Grid Layouts
Build dense GridSpec layouts with shared colorbars and aligned labels for multi-panel figures.
import matplotlib.pyplot as plt
import numpy as np

import dartwork_mpl as dm

dm.style.use("scientific")

np.random.seed(42)

fig = plt.figure(figsize=(dm.cm2in(16), dm.cm2in(12)), dpi=300)

# Create complex GridSpec
gs = fig.add_gridspec(
    nrows=3,
    ncols=3,
    left=0.08,
    right=0.98,
    top=0.95,
    bottom=0.08,
    wspace=0.4,
    hspace=0.5,
)

# Large plot spanning 2x2
ax1 = fig.add_subplot(gs[0:2, 0:2])
x = np.linspace(0, 10, 100)
y = np.sin(x)
ax1.plot(x, y, color="oc.blue5", lw=0.7)
ax1.set_title("Main Plot (2x2)", fontsize=dm.fs(1))
ax1.set_xlabel("X", fontsize=dm.fs(0))
ax1.set_ylabel("Y", fontsize=dm.fs(0))

# Right column - 2 plots
ax2 = fig.add_subplot(gs[0, 2])
ax2.scatter(
    np.random.randn(50), np.random.randn(50), c="oc.red5", s=10, alpha=0.6
)
ax2.set_title("Scatter", fontsize=dm.fs(0))
ax2.tick_params(labelsize=dm.fs(-2))

ax3 = fig.add_subplot(gs[1, 2])
ax3.hist(
    np.random.randn(100),
    bins=15,
    color="oc.green5",
    alpha=0.7,
    edgecolor="oc.green7",
    linewidth=0.3,
)
ax3.set_title("Histogram", fontsize=dm.fs(0))
ax3.tick_params(labelsize=dm.fs(-2))

# Bottom row - 3 plots
ax4 = fig.add_subplot(gs[2, 0])
ax4.bar(
    range(5),
    np.random.rand(5) * 10,
    color="oc.orange5",
    alpha=0.7,
    edgecolor="oc.orange7",
    linewidth=0.3,
)
ax4.set_title("Bar", fontsize=dm.fs(0))
ax4.tick_params(labelsize=dm.fs(-2))

ax5 = fig.add_subplot(gs[2, 1])
x_box = [np.random.normal(0, 1, 50), np.random.normal(1, 1.5, 50)]
ax5.boxplot(x_box, widths=0.5)
ax5.set_title("Box", fontsize=dm.fs(0))
ax5.tick_params(labelsize=dm.fs(-2))

ax6 = fig.add_subplot(gs[2, 2])
theta = np.linspace(0, 2 * np.pi, 50)
r = np.abs(np.sin(2 * theta))
ax6.fill(theta, r, color="oc.violet5", alpha=0.5)
ax6.plot(theta, r, color="oc.violet7", lw=0.5)
ax6.set_title("Polar-like", fontsize=dm.fs(0))
ax6.tick_params(labelsize=dm.fs(-2))

dm.simple_layout(fig, gs=gs)
plt.show()
Total running time of the script: (0 minutes 2.491 seconds)