Note
Go to the end to download the full example code.
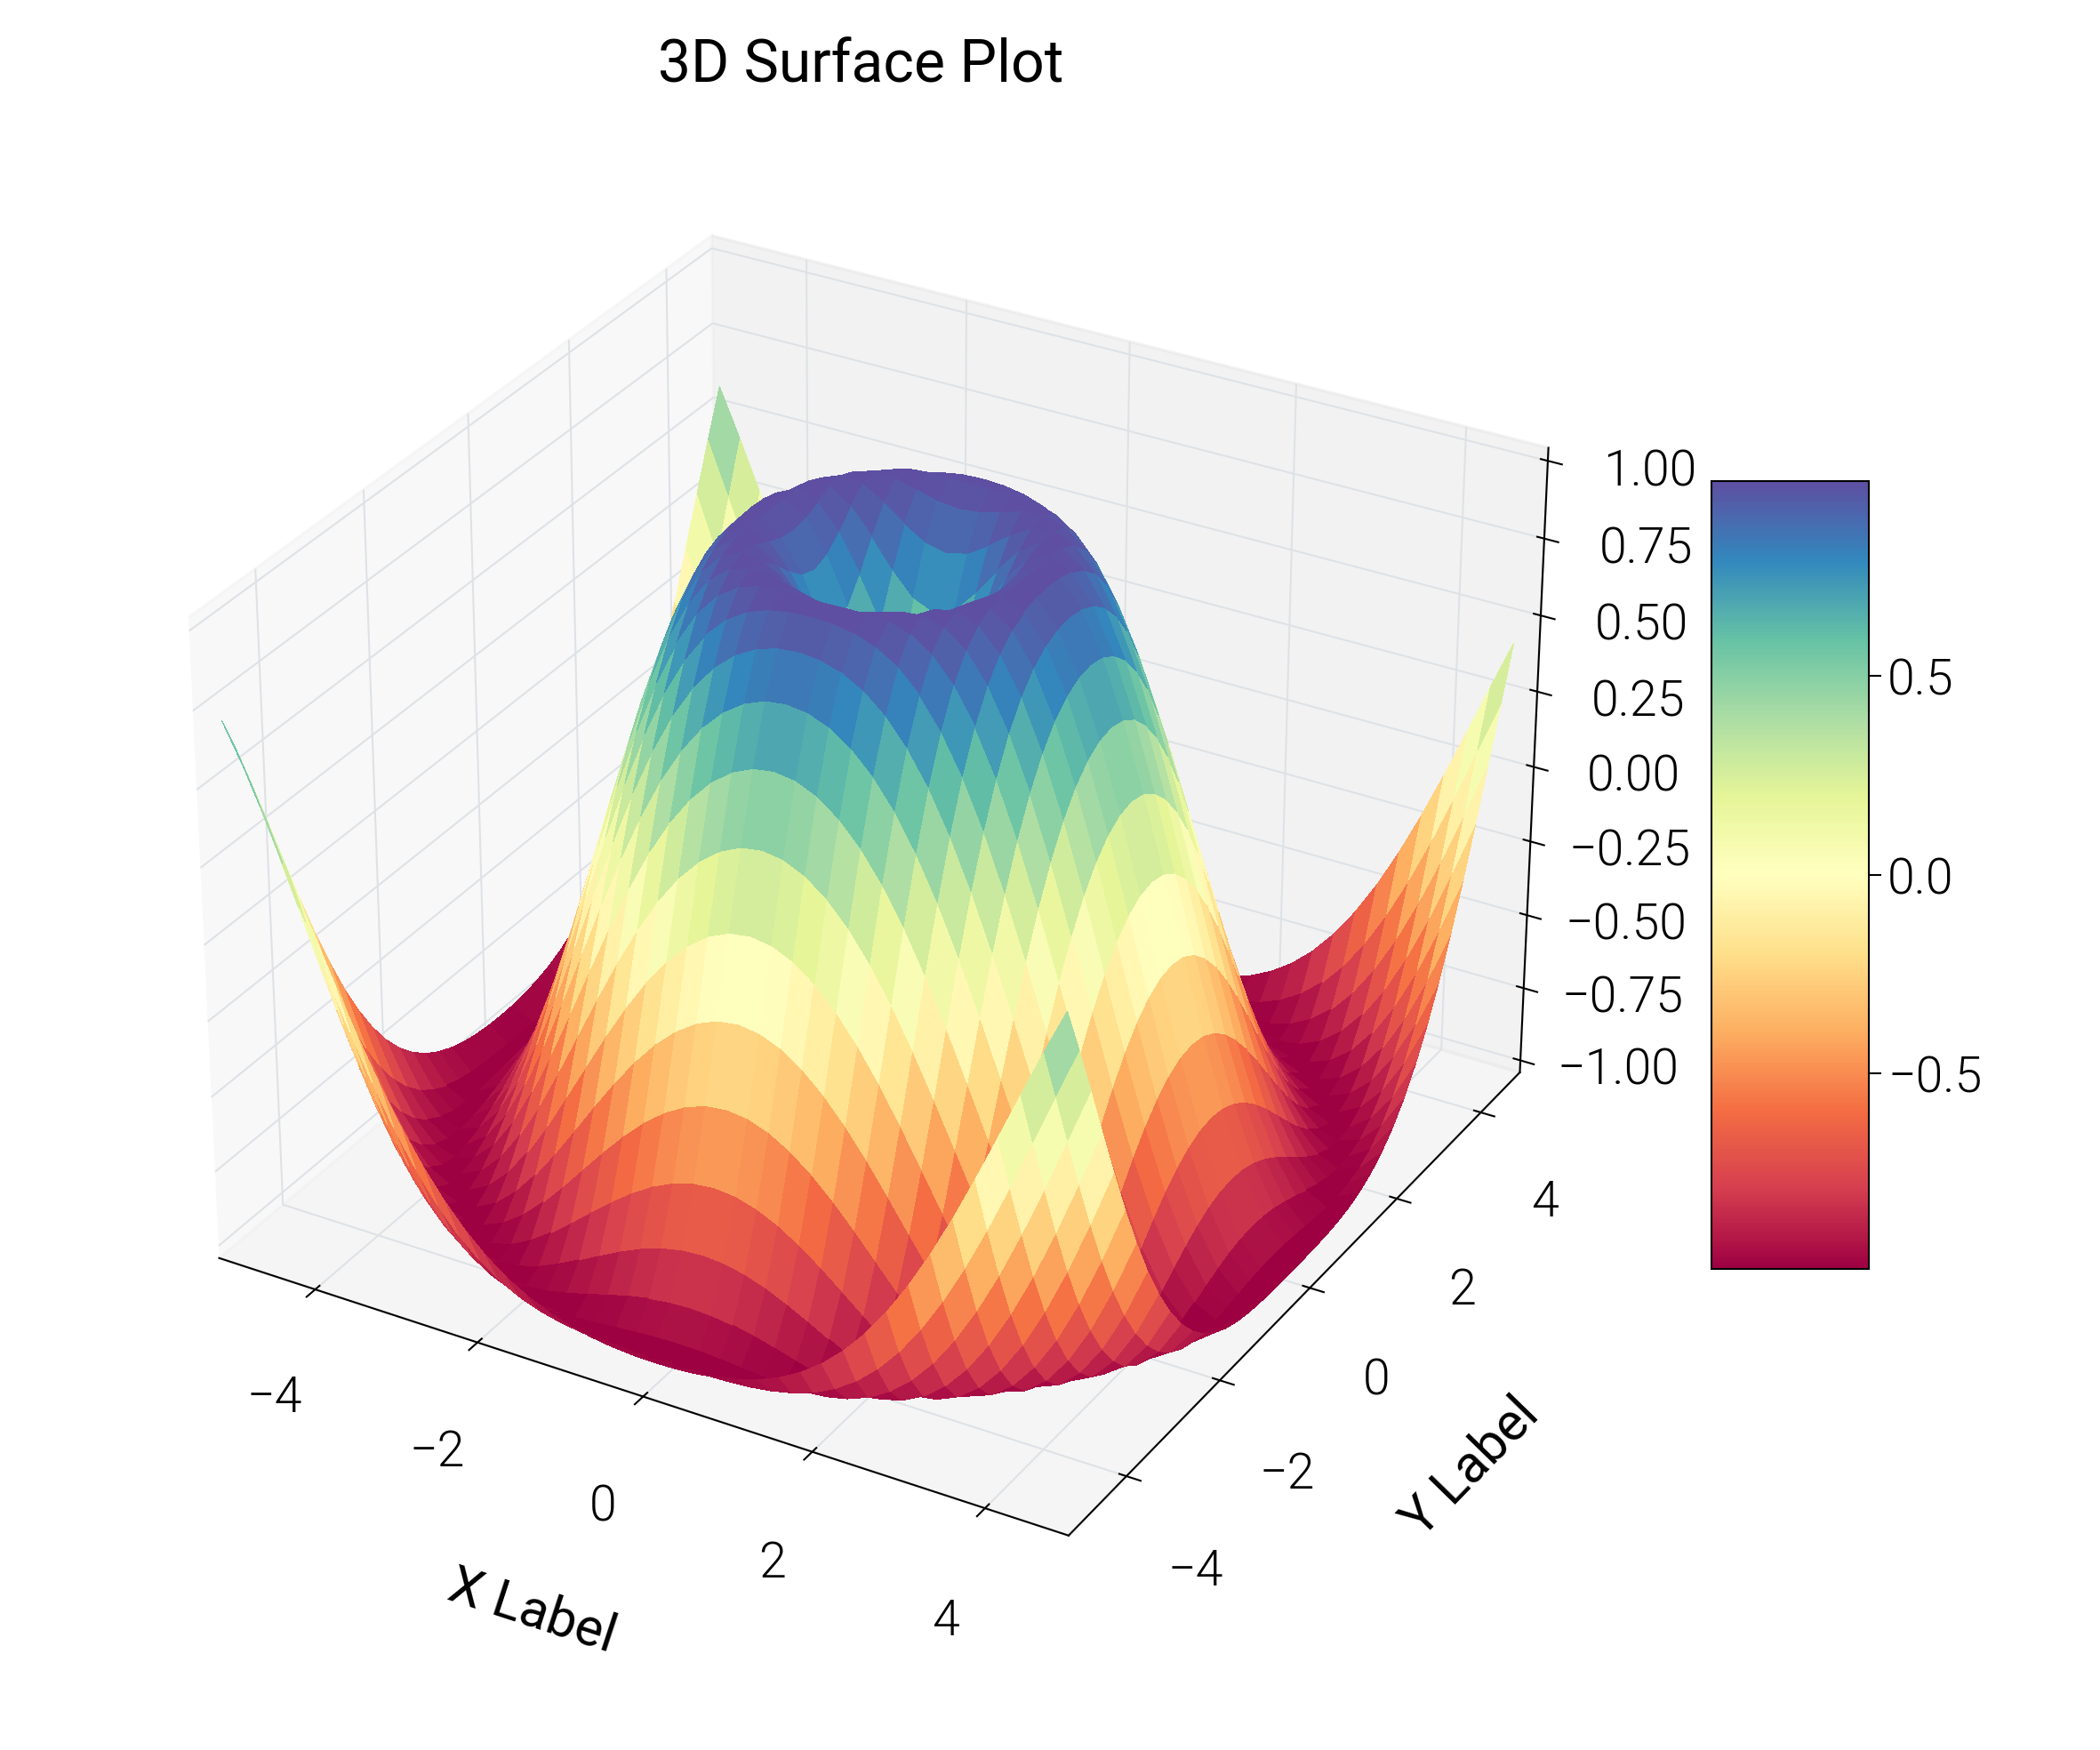
3D Plots
Combine 3D surfaces and scatters with consistent lighting and projection choices for presentations.
/home/runner/work/dartwork-mpl/dartwork-mpl/docs/examples_source/specialized_plots/plot_3d.py:41: UserWarning: This figure includes Axes that are not compatible with tight_layout, so results might be incorrect.
  plt.tight_layout()
import matplotlib.pyplot as plt
import numpy as np

import dartwork_mpl as dm

dm.style.use("presentation")

fig = plt.figure(figsize=(dm.cm2in(12), dm.cm2in(10)), dpi=300)
gs = fig.add_gridspec(1, 1, left=0.05, right=0.95, top=0.95, bottom=0.05)
ax = fig.add_subplot(gs[0, 0], projection="3d")

# Make data
X = np.arange(-5, 5, 0.25)
Y = np.arange(-5, 5, 0.25)
X, Y = np.meshgrid(X, Y)
R = np.sqrt(X**2 + Y**2)
Z = np.sin(R)

# Plot the surface
surf = ax.plot_surface(
    X, Y, Z, cmap="dm.Spectral", linewidth=0, antialiased=False
)

# Customize axis labels with font size utilities
ax.set_xlabel("X Label", fontsize=dm.fs(0))
ax.set_ylabel("Y Label", fontsize=dm.fs(0))
ax.set_zlabel("Z Label", fontsize=dm.fs(0))
ax.set_title("3D Surface Plot", fontsize=dm.fs(1))

# Add a color bar which maps values to colors.
fig.colorbar(surf, shrink=0.5, aspect=5)

# Note: Use tight_layout() for 3D plots as simple_layout() may not work well with 3D axes
plt.tight_layout()
plt.show()
Total running time of the script: (0 minutes 0.510 seconds)