Note
Go to the end to download the full example code.
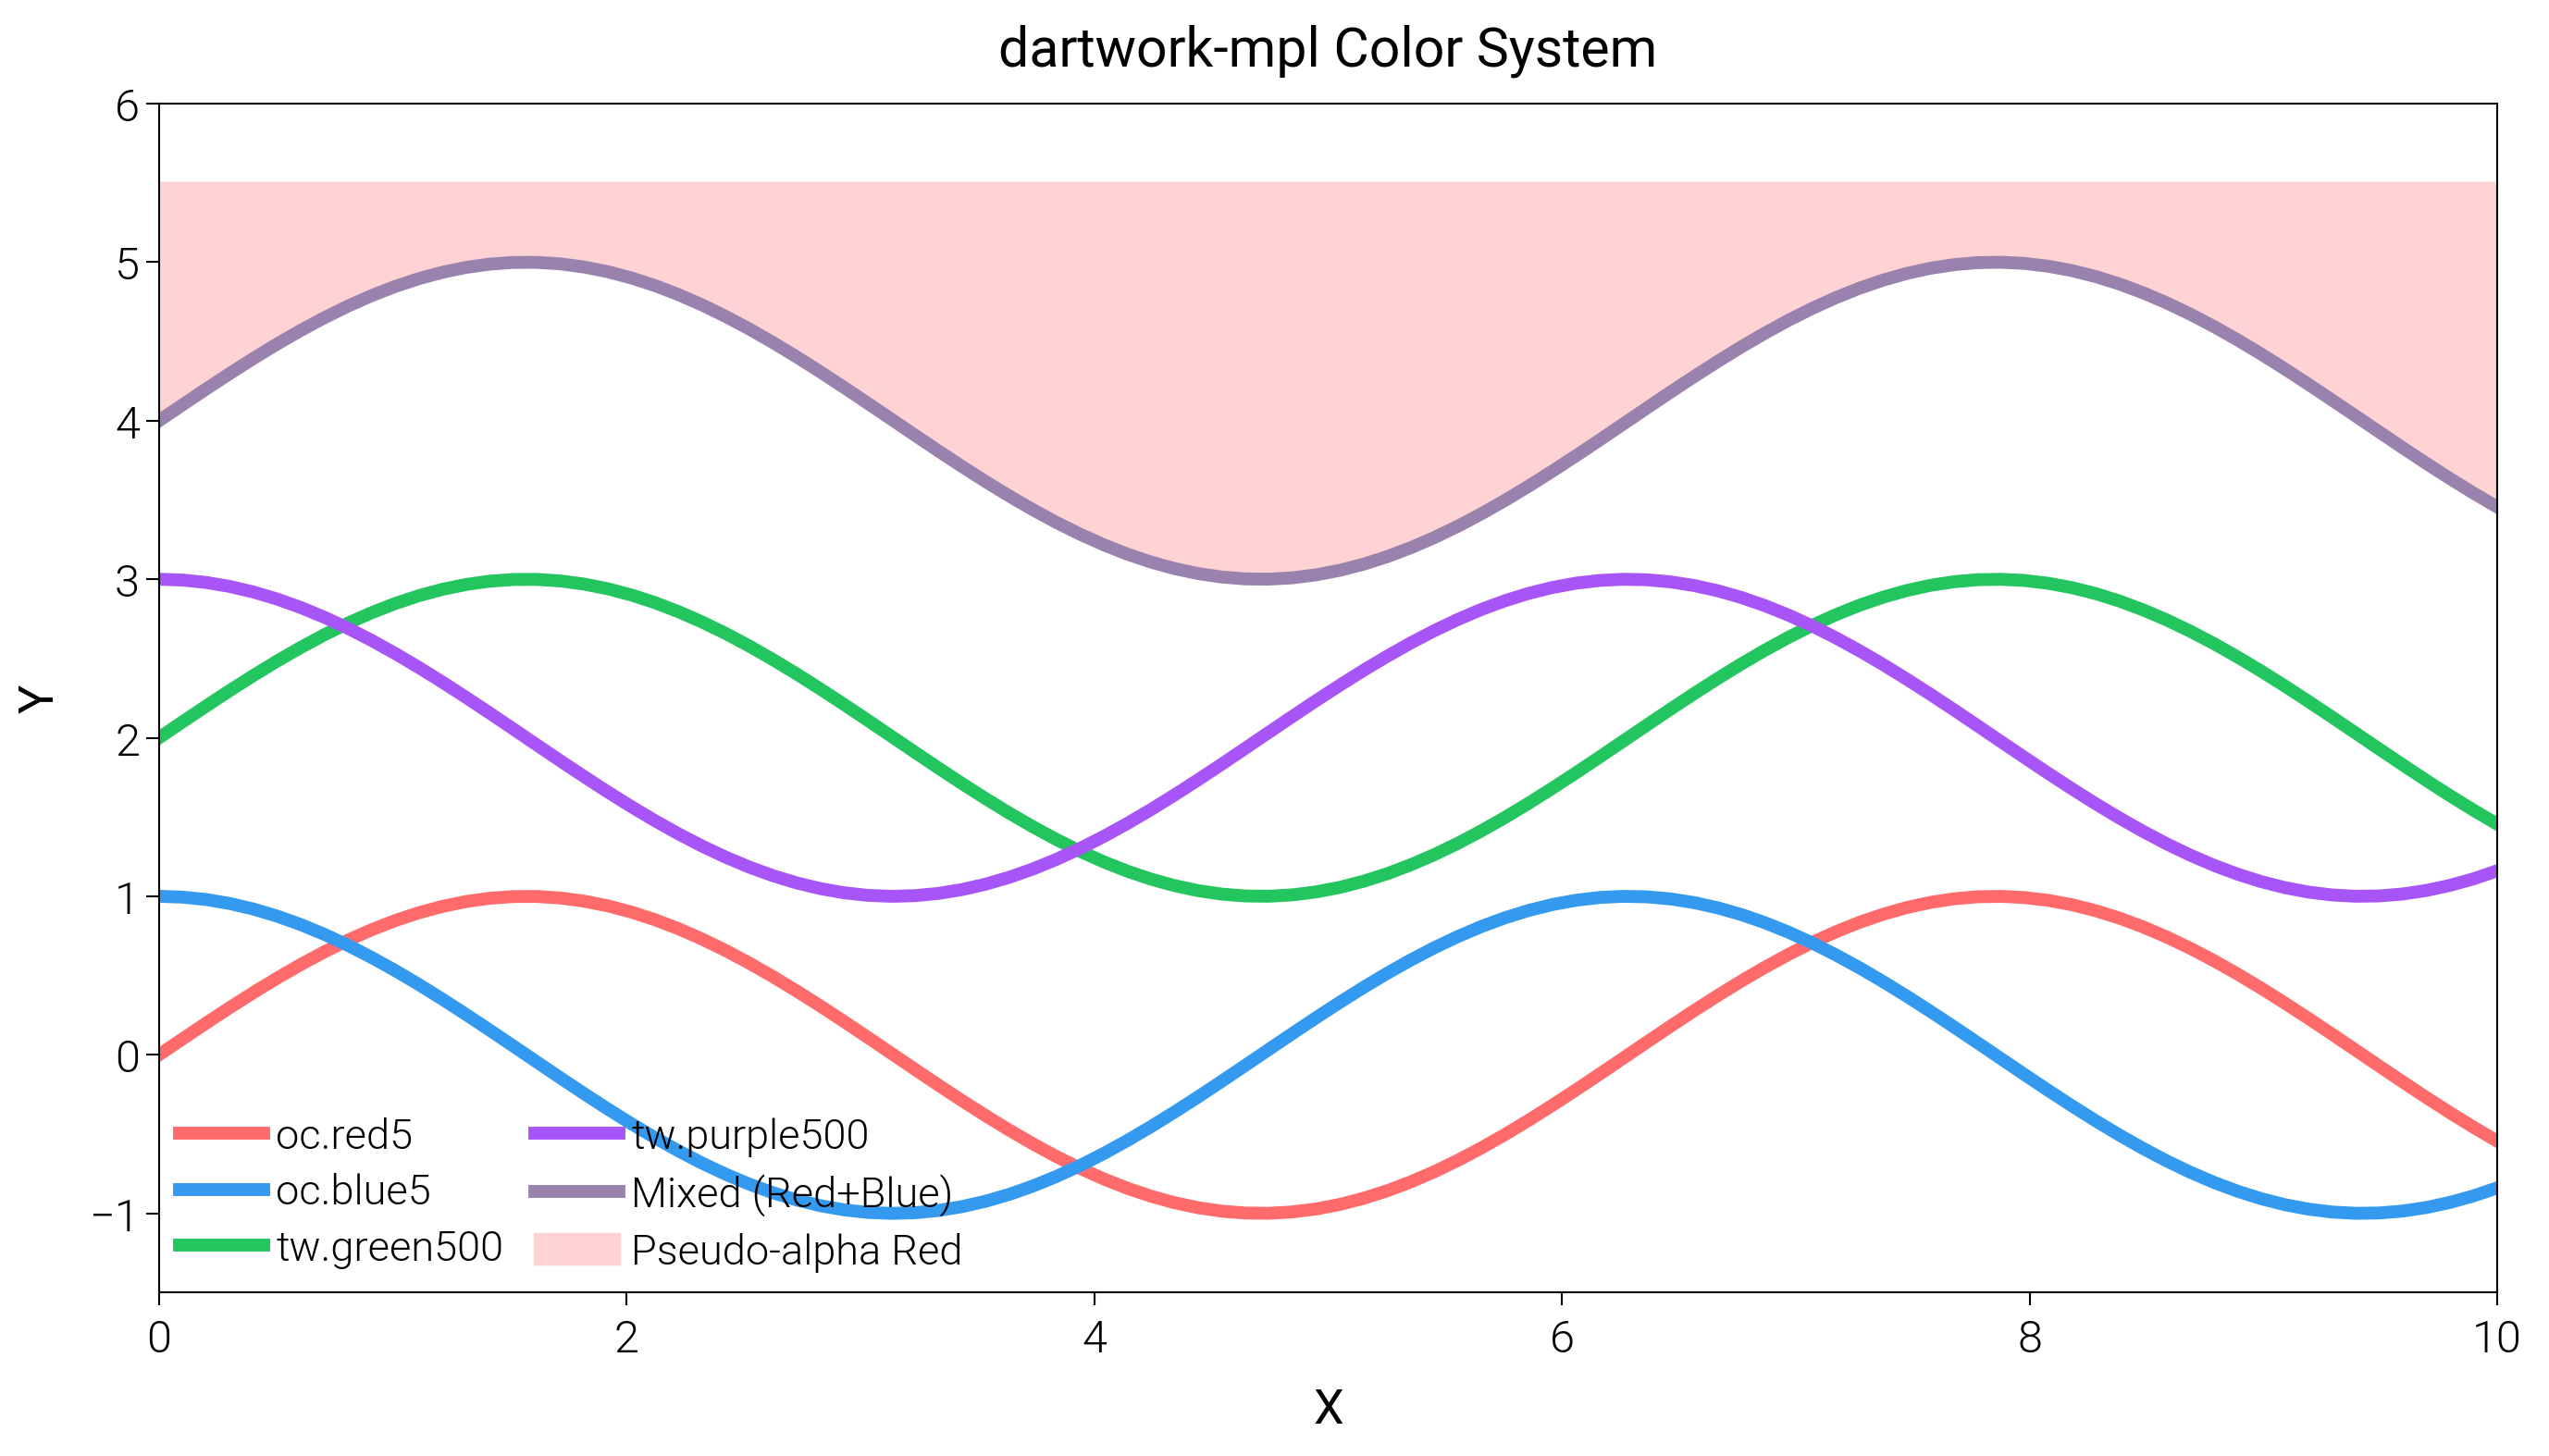
Colors
Browse dartwork color libraries with labeled swatches you can drop into figures.
import matplotlib.pyplot as plt
import numpy as np

import dartwork_mpl as dm

# Apply style
dm.style.use("scientific")

# Create figure
fig = plt.figure(figsize=(dm.cm2in(14), dm.cm2in(8)), dpi=300)
gs = fig.add_gridspec(1, 1, left=0.10, right=0.74, top=0.9, bottom=0.12)
ax = fig.add_subplot(gs[0, 0])

x = np.linspace(0, 10, 100)

# 1. dartwork-mpl custom colors (dm.*)
ax.plot(x, np.sin(x), color="oc.red5", lw=2, label="oc.red5")
ax.plot(x, np.cos(x), color="oc.blue5", lw=2, label="oc.blue5")

# 2. Tailwind CSS colors (tw.* or tw.*)
ax.plot(x, np.sin(x) + 2, color="tw.green500", lw=2, label="tw.green500")
ax.plot(x, np.cos(x) + 2, color="tw.purple500", lw=2, label="tw.purple500")

# 3. Color mixing
# Mix red and blue
mixed_color = dm.mix_colors("oc.red5", "oc.blue5", alpha=0.5)
ax.plot(x, np.sin(x) + 4, color=mixed_color, lw=2, label="Mixed (Red+Blue)")

# 4. Pseudo-transparency
# Create a lighter version of red by mixing with white
transparent_red = dm.pseudo_alpha("oc.red5", alpha=0.3, background="white")
ax.fill_between(
    x, np.sin(x) + 4, 5.5, color=transparent_red, label="Pseudo-alpha Red"
)

ax.set_ylim(-1.5, 6)
ax.set_xlabel("X", fontsize=dm.fs(0))
ax.set_ylabel("Y", fontsize=dm.fs(0))
ax.set_title("dartwork-mpl Color System", fontsize=dm.fs(1))
ax.legend(ncol=2, loc="best", frameon=False, fontsize=dm.fs(-1))

dm.simple_layout(fig, gs=gs)
plt.show()
Total running time of the script: (0 minutes 0.827 seconds)