Note
Go to the end to download the full example code.
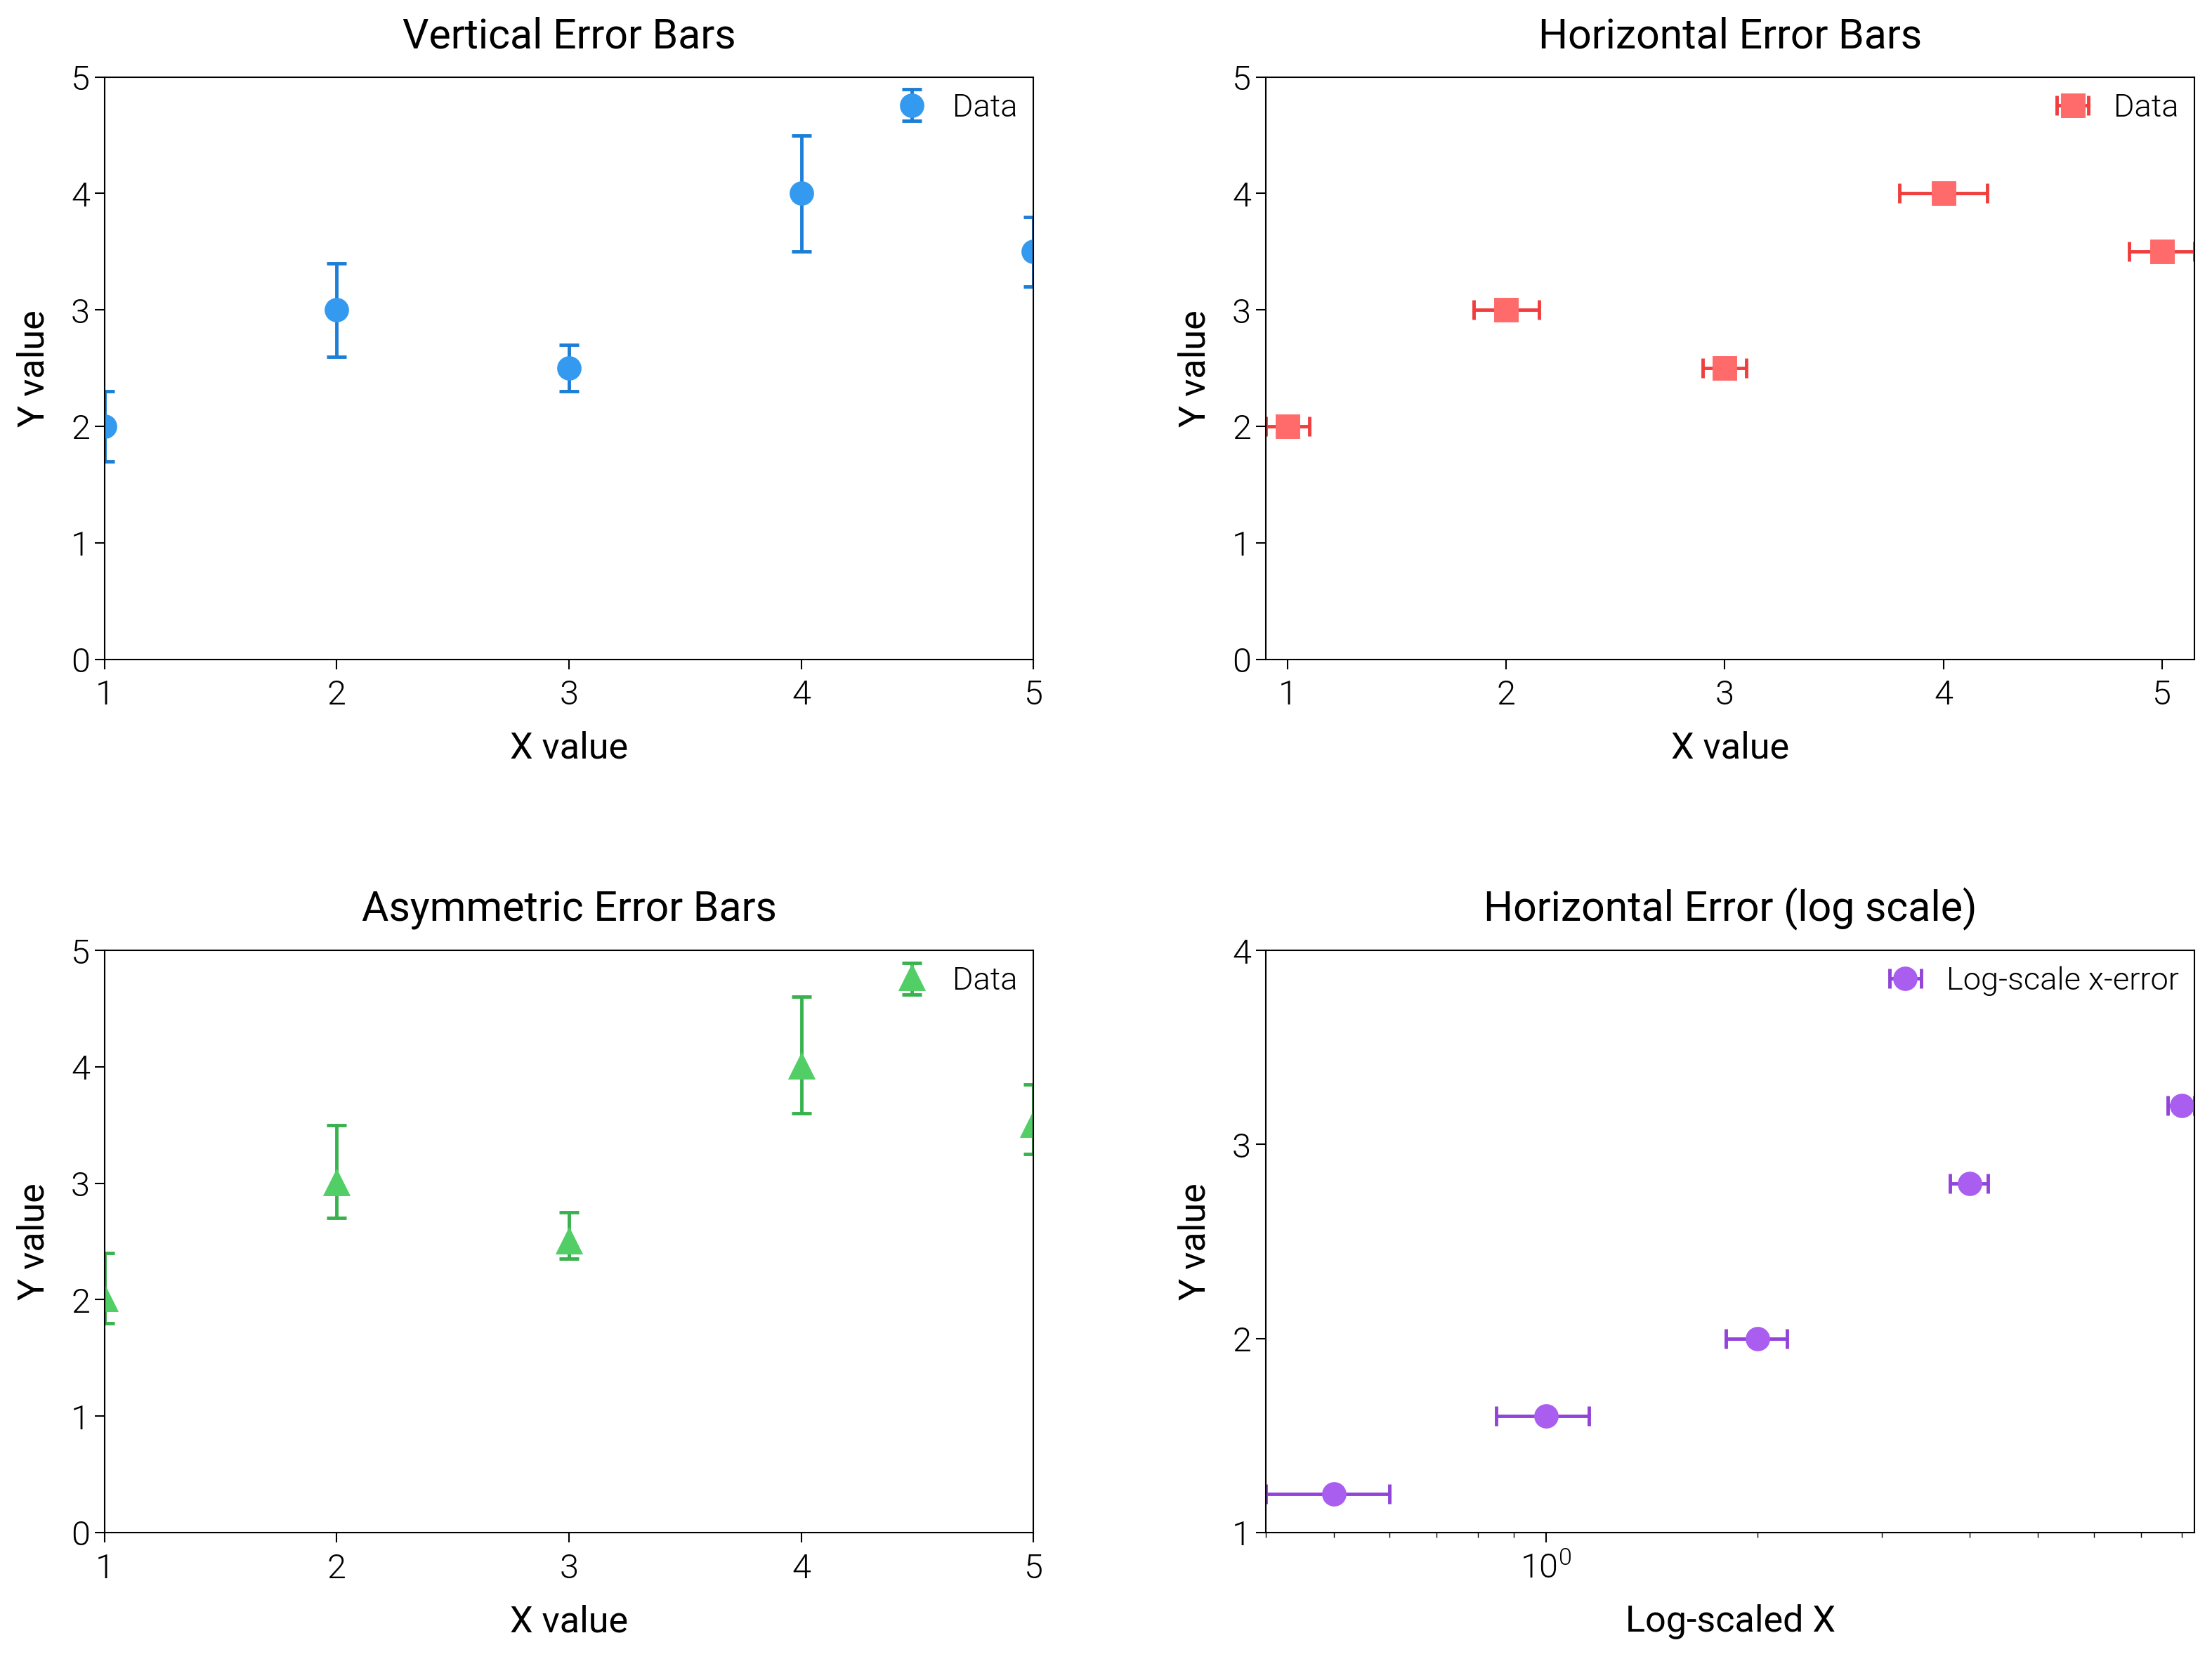
Error Bars
Draw vertical, horizontal, and log-scale error bars with caps and intervals to report uncertainty clearly.
import matplotlib.pyplot as plt
import numpy as np

import dartwork_mpl as dm

# Apply scientific style preset
# Default: font.size=7.5, lines.linewidth=0.5, axes.linewidth=0.3
dm.style.use("scientific")

# Generate sample data
x = np.array([1, 2, 3, 4, 5])
y = np.array([2, 3, 2.5, 4, 3.5])
yerr = np.array([0.3, 0.4, 0.2, 0.5, 0.3])
xerr = np.array([0.1, 0.15, 0.1, 0.2, 0.15])

# Asymmetric error bars
yerr_lower = np.array([0.2, 0.3, 0.15, 0.4, 0.25])
yerr_upper = np.array([0.4, 0.5, 0.25, 0.6, 0.35])

# Create figure (square-ish): 16 cm wide, 12 cm tall
fig = plt.figure(figsize=(dm.cm2in(16), dm.cm2in(12)), dpi=300)

# Create GridSpec for 4 subplots (2x2)
gs = fig.add_gridspec(
    nrows=2,
    ncols=2,
    left=0.08,
    right=0.98,
    top=0.92,
    bottom=0.12,
    wspace=0.25,
    hspace=0.5,
)

# Panel A: Vertical error bars
ax1 = fig.add_subplot(gs[0, 0])
# Explicit parameters: elinewidth=0.7, capsize=2, capthick=0.7, markersize=4
ax1.errorbar(
    x,
    y,
    yerr=yerr,
    fmt="o",
    color="oc.blue5",
    ecolor="oc.blue7",
    elinewidth=0.7,
    capsize=2,
    capthick=0.7,
    markersize=4,
    label="Data",
)
ax1.set_xlabel("X value", fontsize=dm.fs(0))
ax1.set_ylabel("Y value", fontsize=dm.fs(0))
ax1.set_title("Vertical Error Bars", fontsize=dm.fs(1))
ax1.legend(loc="best", fontsize=dm.fs(-1), ncol=1)
# Set explicit ticks
ax1.set_xticks([1, 2, 3, 4, 5])
ax1.set_yticks([0, 1, 2, 3, 4, 5])

# Panel B: Horizontal error bars
ax2 = fig.add_subplot(gs[0, 1])
# Explicit parameters: xerr instead of yerr
ax2.errorbar(
    x,
    y,
    xerr=xerr,
    fmt="s",
    color="oc.red5",
    ecolor="oc.red7",
    elinewidth=0.7,
    capsize=2,
    capthick=0.7,
    markersize=4,
    label="Data",
)
ax2.set_xlabel("X value", fontsize=dm.fs(0))
ax2.set_ylabel("Y value", fontsize=dm.fs(0))
ax2.set_title("Horizontal Error Bars", fontsize=dm.fs(1))
ax2.legend(loc="best", fontsize=dm.fs(-1), ncol=1)
# Set explicit ticks
ax2.set_xticks([1, 2, 3, 4, 5])
ax2.set_yticks([0, 1, 2, 3, 4, 5])

# Panel C: Asymmetric error bars
ax3 = fig.add_subplot(gs[1, 0])
# Explicit parameters: yerr=[yerr_lower, yerr_upper] for asymmetric
ax3.errorbar(
    x,
    y,
    yerr=[yerr_lower, yerr_upper],
    fmt="^",
    color="oc.green5",
    ecolor="oc.green7",
    elinewidth=0.7,
    capsize=2,
    capthick=0.7,
    markersize=4,
    label="Data",
)
ax3.set_xlabel("X value", fontsize=dm.fs(0))
ax3.set_ylabel("Y value", fontsize=dm.fs(0))
ax3.set_title("Asymmetric Error Bars", fontsize=dm.fs(1))
ax3.legend(loc="best", fontsize=dm.fs(-1), ncol=1)
# Set explicit ticks
ax3.set_xticks([1, 2, 3, 4, 5])
ax3.set_yticks([0, 1, 2, 3, 4, 5])

# Panel D: Error bars on log-scale
ax4 = fig.add_subplot(gs[1, 1])
log_x = np.array([0.5, 1, 2, 4, 8])
log_y = np.array([1.2, 1.6, 2.0, 2.8, 3.2])
log_err = np.array([0.1, 0.15, 0.2, 0.25, 0.35])
ax4.errorbar(
    log_x,
    log_y,
    xerr=log_err,
    fmt="o",
    color="oc.purple5",
    ecolor="oc.purple7",
    elinewidth=0.7,
    capsize=2,
    capthick=0.7,
    markersize=4,
    label="Log-scale x-error",
)
ax4.set_xscale("log")
ax4.set_xlabel("Log-scaled X", fontsize=dm.fs(0))
ax4.set_ylabel("Y value", fontsize=dm.fs(0))
ax4.set_title("Horizontal Error (log scale)", fontsize=dm.fs(1))
ax4.legend(loc="best", fontsize=dm.fs(-1))
ax4.set_yticks([1, 2, 3, 4])

# Optimize layout
dm.simple_layout(fig, gs=gs)

# Show plot
plt.show()
Total running time of the script: (0 minutes 1.961 seconds)